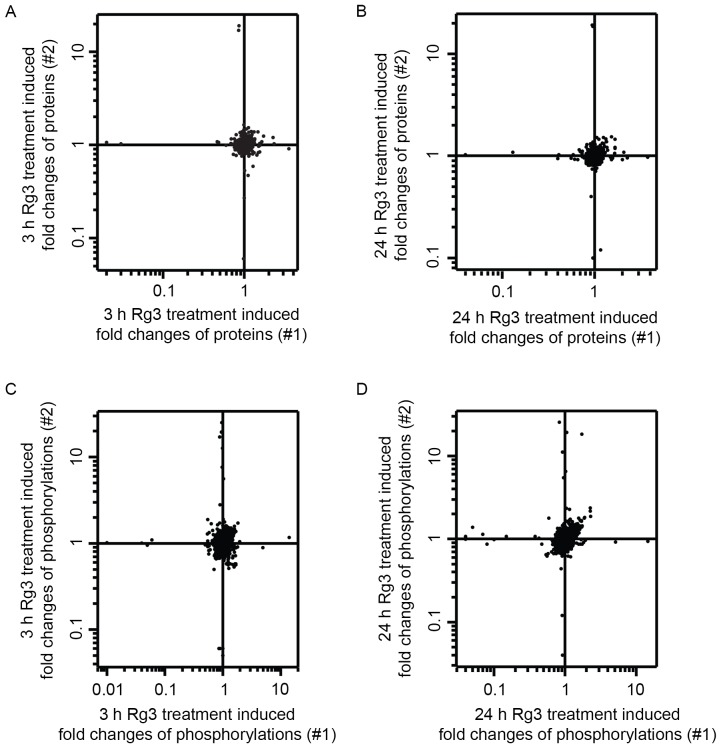
Figure 3.
Quantitative analysis of fold changes of proteins and phosphorylation in ginsenoside Rg3-treated MDA-MB-231 cells. Density scatter plot of fold changes of (A and B) protein expression and (C and D) level of protein phosphorylation at (A and C) 3 h and (B and D) 24 h in ginsenoside Rg3-treated MDA-MB-231 cells. All the data have been log10-transformed.

