. 2017 Jun 6;19(35):23740–23746. doi: 10.1039/c7cp02434g

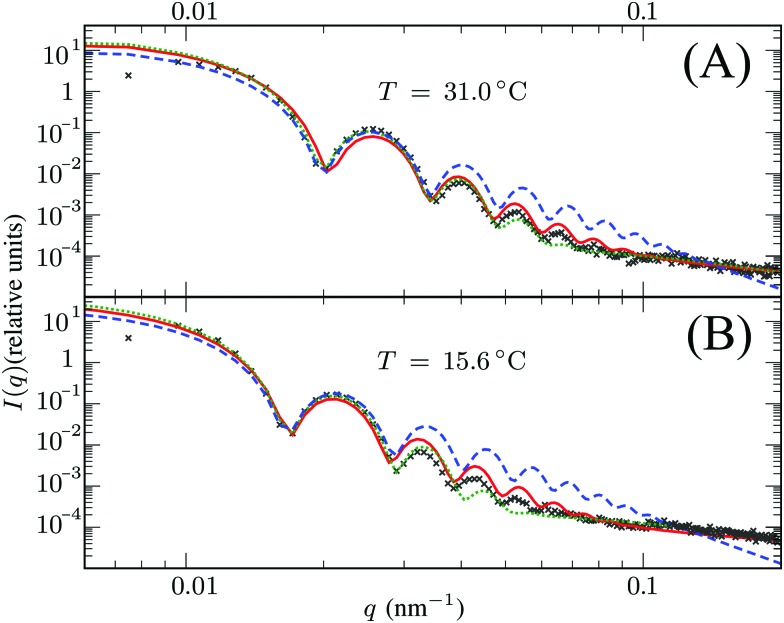
Fig. 4. Intensity profiles for PNIPAM particles at (A) 31 °C and (B) 15 °C, showing the experimental data (symbols) and the model introduced in this work (solid red line) using R = 250 nm in (A) and R = 305 nm in (B). The green dotted line corresponds to the fuzzy sphere model, using R = 225 nm and σ = 30 nm in (A), and R = 268 nm and σ = 40 nm in (B). For completeness, we also show by the blue dashed line a simple spherical core with the same radius Rc as the fuzzy sphere. Both solid lines include an additional Lorentzian term to include a contribution from fluctuations of the network characterized by a mesh size ξ. The polydispersity was chosen 3.5–4% in all cases.

Fig. 4