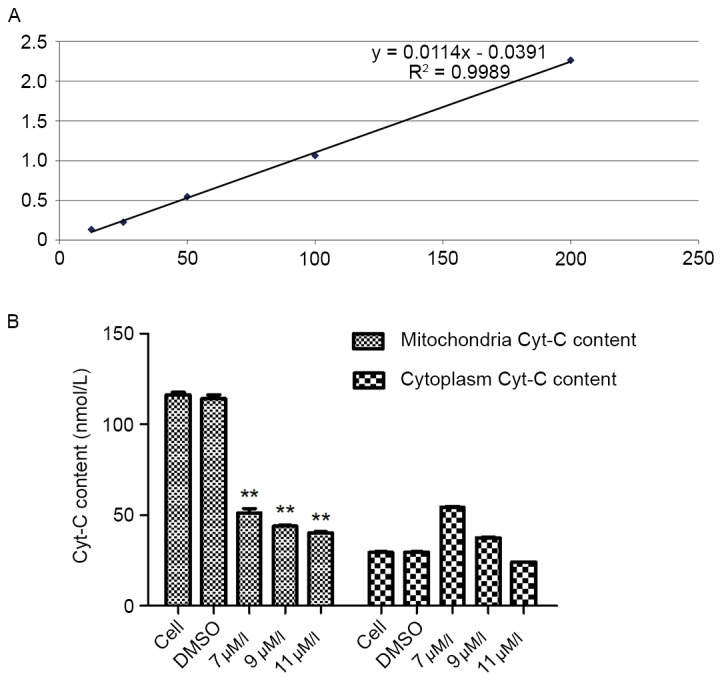
Figure 6.

Effects of the oleanolic acid derivative on Cyt-C release from the mitochondria in SMMC-7721 cells. (A) The standard curve of Cyt-C. The standard curve regression equation was y=0.0114×-0.0391 (R2=0.9989). (B) SMMC-7721 cells were treated with the oleanolic acid derivative (0, 7, 9 or 11 µM) or vehicle (0.11% DMSO) alone. Cytoplasmic and mitochondrial fractions were obtained at 12 h after treatment, and the content of Cyt-C was analyzed using a Human Cyt-C ELISA kit. Cyt-C, cytochrome C; DMSO, dimethyl sulfoxide. **P<0.05 vs. DMSO.
