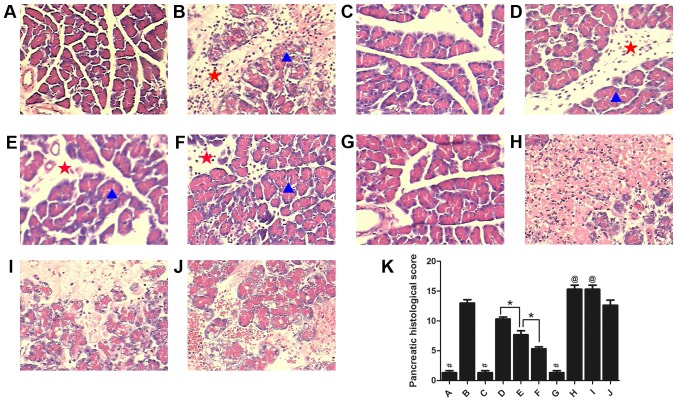
Figure 2.
Morphological changes in the pancreas and the pancreatic histological scores in each group (n=10). Stained sections from the (A) Sham, (B) AP, (C) Sham+Rut (100 µg/kg), (D) AP+Rut L (30 µg/kg), (E) AP+Rut M (100 µg/kg), (F) AP+Rut H (300 µg/kg), (G) Sham+Cap, (H) AP+Cap, (I) AP+Cap+Rut (100 µg/kg) and (J) AP+Sol groups. Magnification, ×200. (K) Quantification of histological scores of the different groups. Results are presented as the mean ± standard deviation. Pancreatic acinar are indicated with a blue triangle and the interlobular septum is indicated with a red star. Conspicuous hemorrhagic necrosis, pancreatic edema, interstitial leukocyte and erythrocyte infiltration and acinar cell vacuolization were demonstrated in the AP only group. However, pancreatic injuries were markedly alleviated in the AP+Rut groups. Magnification, ×200. *P<0.05; #P<0.05 vs. (B), (D-F) and (H-J); @P<0.05 vs. (A-G) and (J); AP, acute pancreatitis; Rut, rutaecarpine; Cap, capsazepine.

