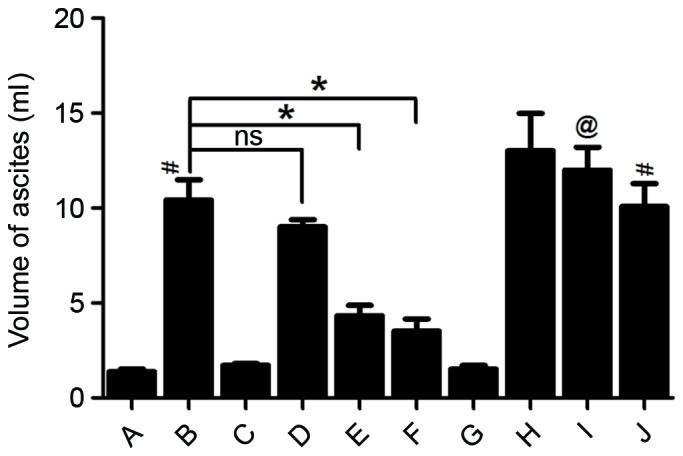
Figure 3.

Changes in the volume of ascites. (A) Sham; (B) AP; (C) Sham+Rut (100 µg/kg); (D) AP+Rut L (30 µg/kg); (E) AP+Rut M (100 µg/kg); (F) AP+Rut H (300 µg/kg); (G) Sham+Cap; (H) AP+Cap; (I) AP+Cap+Rut (100 µg/kg); (J) AP+Sol. Results are presented as the mean ± standard deviation. (n=10). #P<0.05 vs. (A), (C) and (G); @P<0.05 vs. (E); *P<0.05. AP, acute pancreatitis; Rut, rutaecarpine; Cap, capsazepine; ns, not significant.
