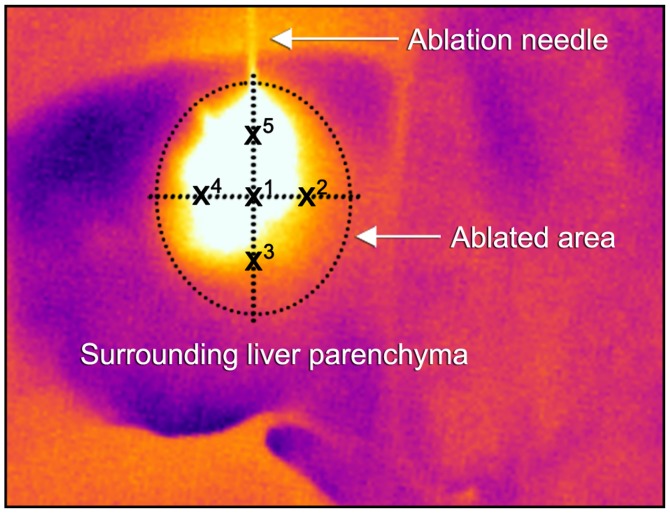
Figure 3.
Thermographic temperature measurements model. Illustration of real-time infrared surface temperature measurements during an ongoing MWA. Values were calculated for each ablation by creating a mean value of temperatures at the ablation needle tip (X1) and at 50% of the total ablation zone in each direction (X2−5). MWA, microwave ablation.

