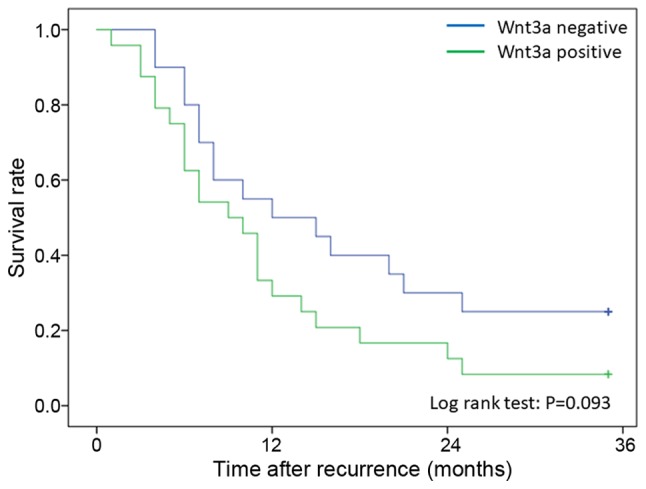
Figure 5.

Survival after recurrence curve of patients according to Wnt3a expression. These curves were calculated by the Kaplan-Meier method. The green line is Wnt3a-positive group and the blue line is Wnt3a-negative group. Difference between two groups were evaluated by log-rank test.
