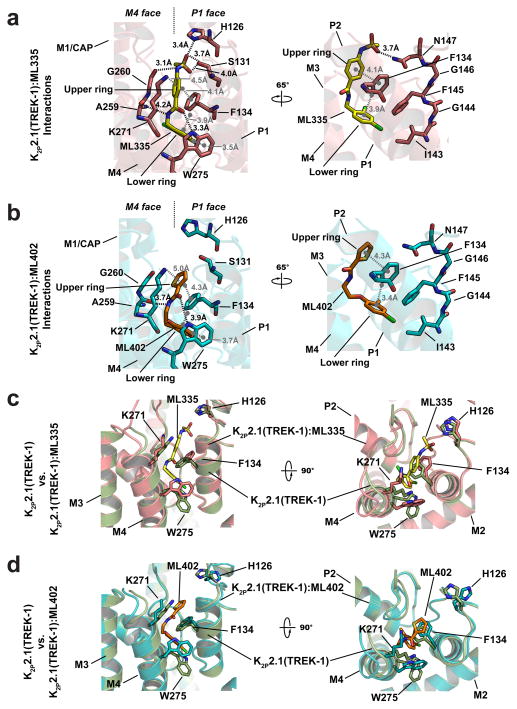
Figure 2. K2P2.1(TREK-1) activator interactions.
Cartoon diagram of a, K2P2.1(TREK-1):ML335 and b, K2P2.1(TREK-1):ML402 interactions. Electrostatic and hydrogen bond interactions are black. Cation-π and π-π interactions are grey. c, and d, comparison of K2P2.1(TREK-1) (smudge) with c, K2P2.1(TREK-1):ML335 (deep salmon) and d, K2P2.1(TREK-1):ML402 (cyan).

