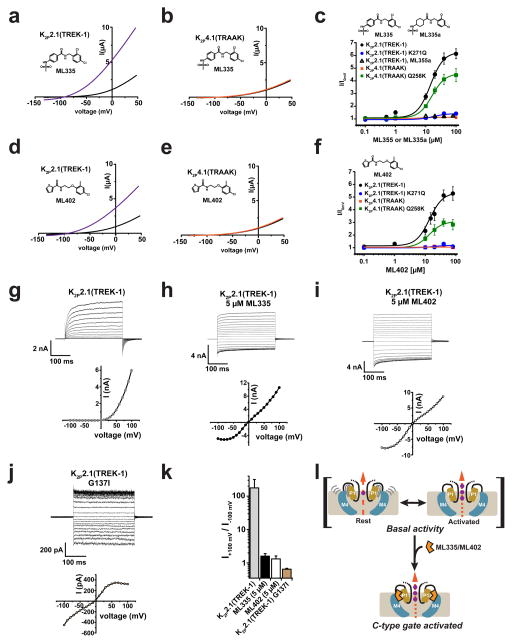
Figure 4. K2P2.1(TREK-1) activator function.
Exemplar current traces for a, K2P2.1(TREK-1) (black) with 20 μM ML335 (purple). b, K2P4.1(TRAAK) (black) with 50 μM ML335 (orange). c, ML335 dose response curves for K2P2.1(TREK-1) (black), EC50=14.3 ± 2.7 μM (n≥5); K2P2.1(TREK-1) K271Q (blue filled circles); K2P4.1(TRAAK) (orange); K2P4.1(TRAAK) Q258K (green) EC50=16.2 ± 3.0 μM (n≥4); and ML335a: K2P2.1(TREK-1) (black open triangles). Exemplar current traces for d, K2P2.1(TREK-1) (black) with 20 μM ML402 (purple). e, K2P4.1(TRAAK) (black) with 50 μM ML335 (orange). f, ML402 dose response curves for K2P2.1(TREK-1) (black), EC50=13.7 ± 7.0 μM (n≥3); K2P2.1(TREK-1) K271Q (blue); K2P2.1(TREK-1) (blue); K2P4.1(TRAAK) (orange); K2P4.1(TRAAK) Q258K (green) EC50=13.6 ± 1.5 μM (n≥3). g–j, Exemplar current traces and voltage-current relationships for indicated K2Ps in HEK293 inside-out patches in 150 mM K+[out]/150 mM Rb+[in] for g, K2P2.1(TREK-1), h, K2P2.1(TREK-1) with 5 μM ML335, I, K2P2.1(TREK-1) with 5 μM ML402, and j, K2P2.1(TREK-1) G137I. k, Rectification coefficients (I+100mV/I–100mV) from recordings (n≥3) made in ‘g–j’. l, TREK activation model. Grey lines indicate mobile P1 (tan) and M4 (blue). C-type activators (orange), stabilize the selectivity filter and channel ‘leak mode’. Potassium ions are purple. Gap in arrows indicates current flow intensity. Membrane is grey.

