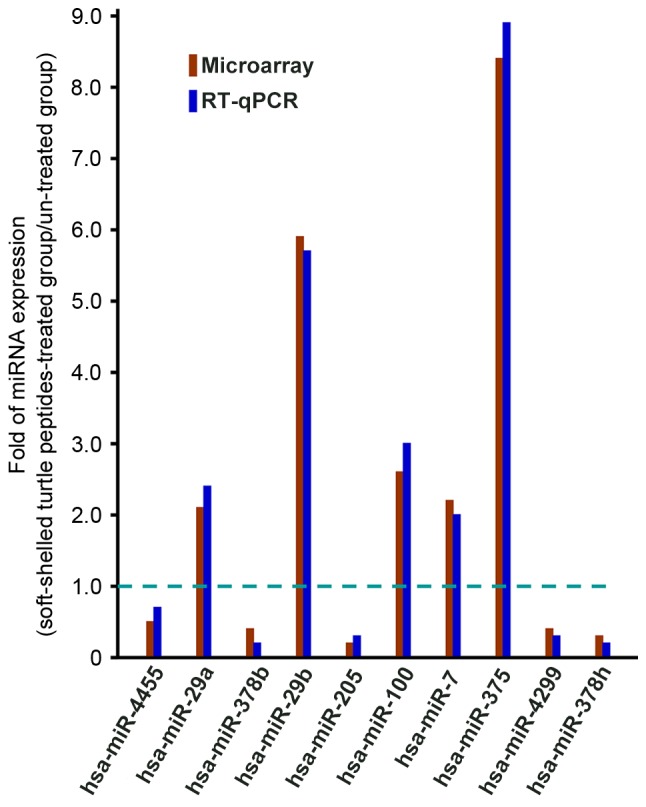
Figure 2.

RT-qPCR validation of differentially expressed miRNAs that were screened by the microarray assay. Upregulated and downregulated miRNAs are indicated by bars above and below the dotted line respectively. The RT-qPCR results were representative of three independent experiments. RT-qPCR, reverse transcription-quantitative polymerase chain reaction; miRNA, microRNA.
