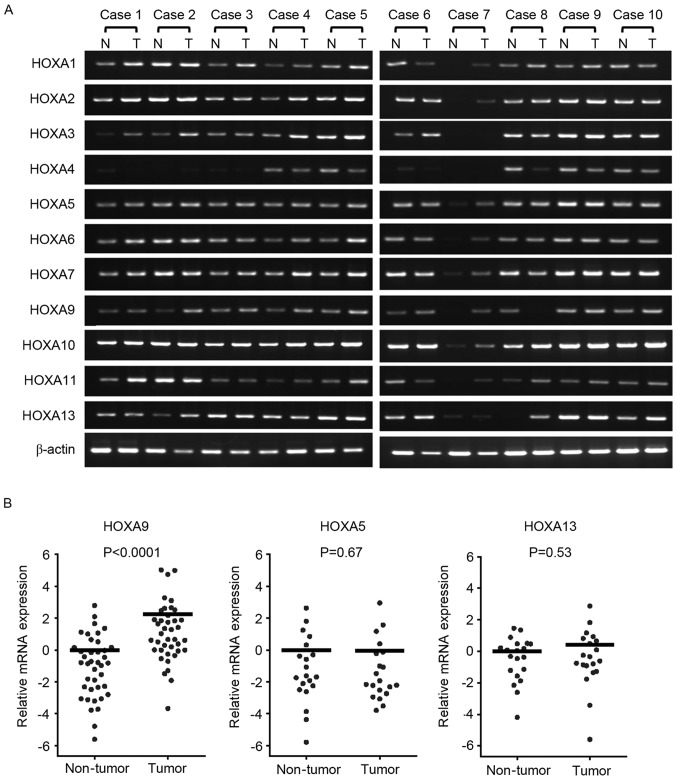
Figure 1.
mRNA expression levels of HOXA cluster genes in patients with CRC. (A) The mRNA expression of HOXA genes in patients with CRC. A total of 10 representative cases of tumor and non-tumor tissues were analyzed by RT-qPCR. β-actin was used as a loading control. (B) Differences in HOXA9 expression between tumor (n=40) and non-tumor (n=40) tissues, and HOXA5 and HOXA13 expression levels between tumor (n=20) and non-tumor (n=20) tissues as determined by qPCR and Wilcoxon matched pairs test. A log2 scale has been used for the y-axis. The mRNA expression in tumor tissues was normalized to the expression in non-tumor tissues. The horizontal bars indicate mean expression value. T, tumor; N, non-tumor; HOX, homeobox; CRC, colorectal cancer; RT-qPCR, reverse transcription-quantitative polymerase chain reaction.

