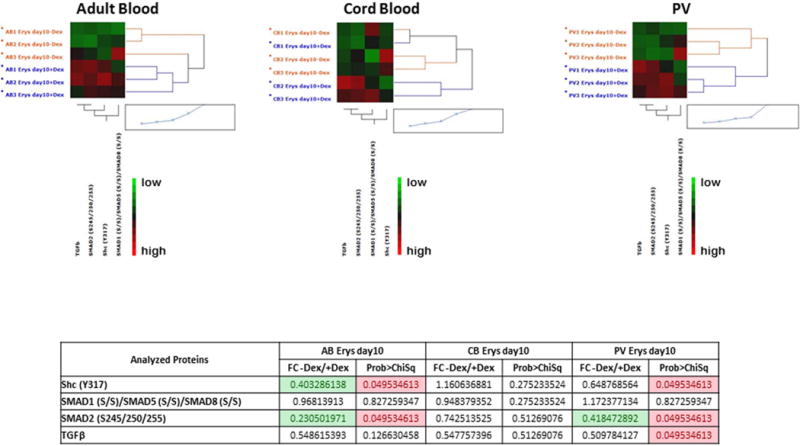
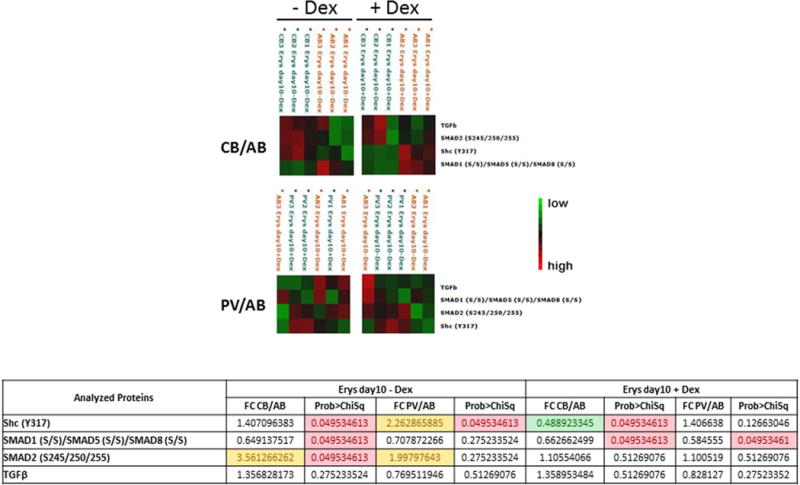
Figure 9. Characterization of TGF-β signaling pathway in Day 10 Erys from AB, CB and JAK2+-PV by Reverse Phase Protein Array.


(the complete phosphoproteomic data set is available at http://capmm.gmu.edu/data).
A) Hierarchical clustering representing Erys expanded from three separate AB, CB and JAK2+-PV (allele burden 67, 88 and 94%) respectively) in cultures with (blue) or without (red) Dex (horizontal axis) and the analyzed total or phospho-proteins (vertical axis). Specific endpoint relative intensity values have been used to create the heatmap after overall standardization. Within the heatmap, red color represents higher levels of relative activity/expression; black represents intermediate levels, and green represents lower levels of relative activity/expression. The table on the bottom summarizes the results as fold-change (FC) between minus Dex/plus Dex) for each group. Fold-changes <0.5 are highlighted in green. Group mean differences statistically significant (p<0.05) are highlighted in pink. The comparison of data from PV with and without Dex was already reported [34].
B) Hierarchical clustering representing Erys expanded from three separate AB with (left panels) and without (right panel) Dex with respect to the same cells obtained under the same conditions from CB (top panels) or JAK2+-PV (the same donors as in A) (horizontal axis) and the analyzed total or phospho-proteins (vertical axis). See legend to Fig. 9A for further detail. Fold-changes (FC) between CB and AB and PV and AB obtained minus Dex and plus Dex are summarized in the Table on the bottom. Fold-changes <0.5 or <1.5 are highlighted in green and yellow, respectively. Group mean differences statistically significant (p<0.05) are highlighted in pink. The comparison of data obtained from AB and PV with Dex was already reported [34].
