
Figure 2.
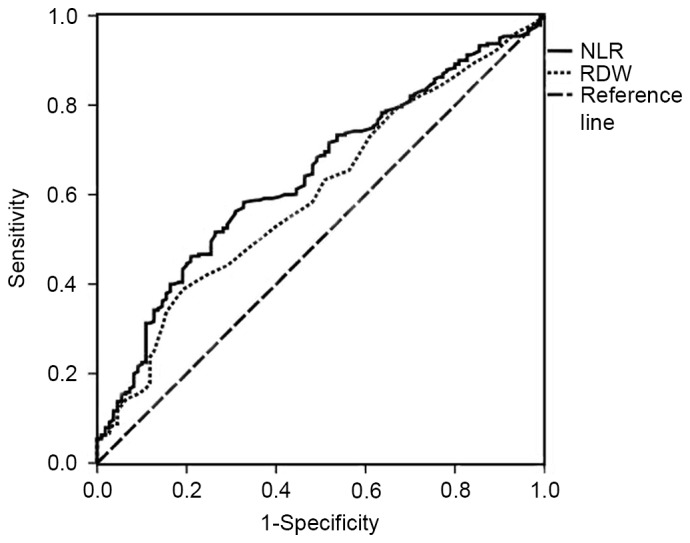
ROC curves grouped by NLR and RDW. The ROC for NLR is represented by a full line with an AUC of 0.642, sensitivity of 58.3% and specificity of 67.3% (P<0.001) and the ROC for the RDW is represented by a dotted line with an AUC of 0.601, sensitivity of 38.8% and specificity of 80.9% (P=0.002). ROC, receiver operating characteristic; NLR, neutrophil-to-lymphocyte ratio; RDW, red blood cell distribution width; AUC, area under the curve.