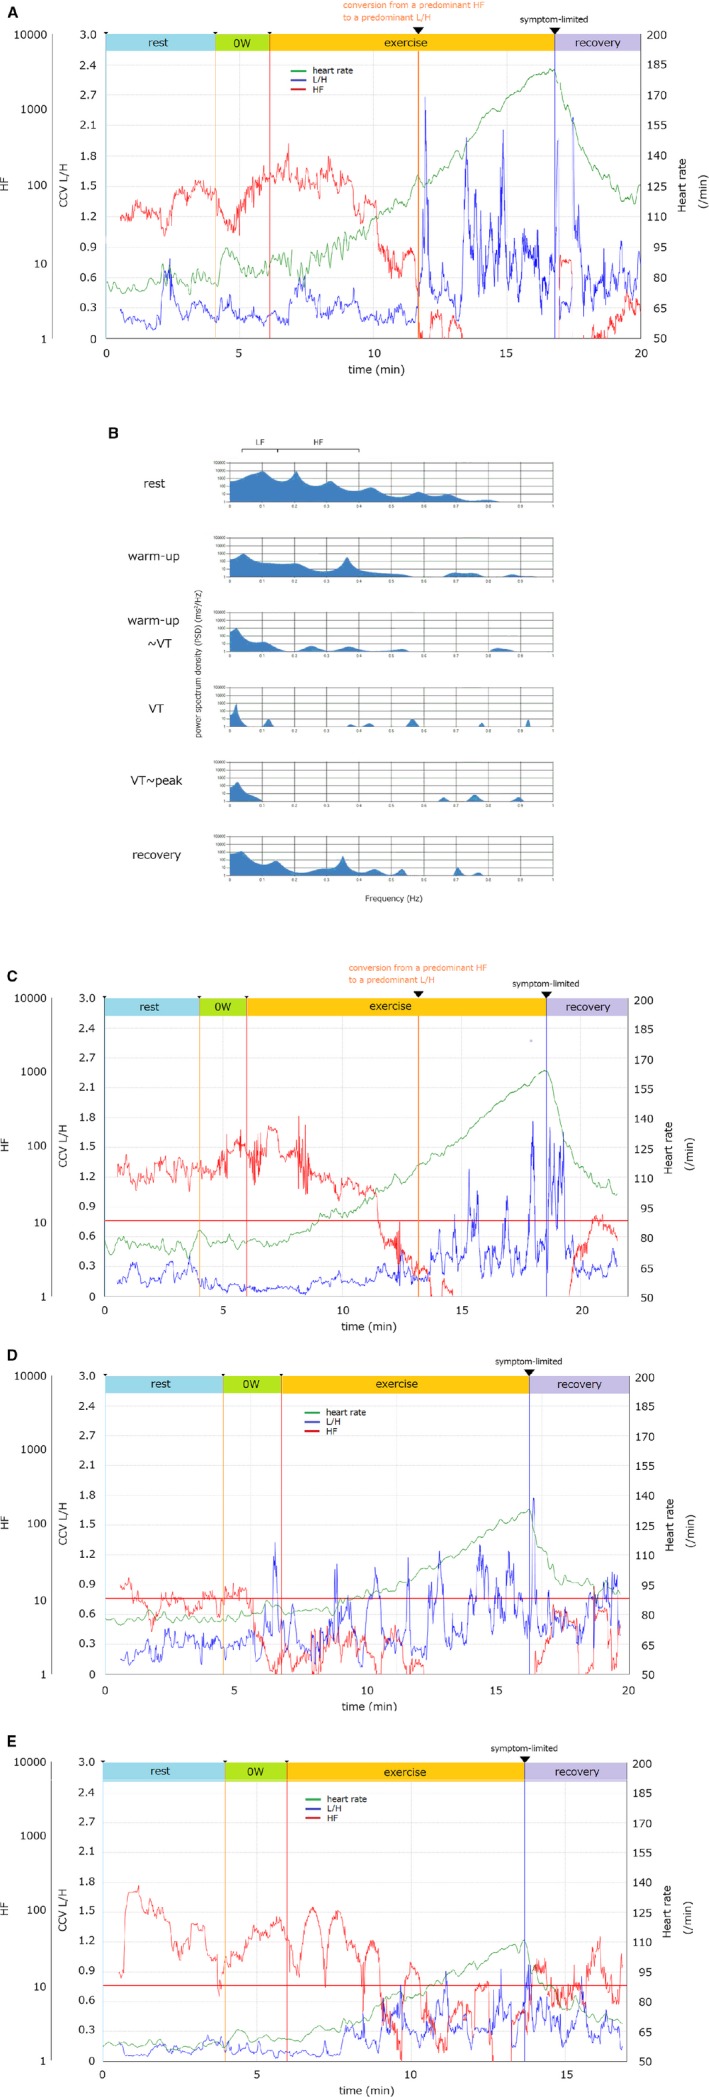
Figure 1.

Quantitative imaging of the power spectrum of heart rate variability during incremental exercise. A, C, D, and E, Representative graphs of the high‐frequency component (HF; red), coefficient of component variance ratio of the low‐frequency component to the HF (CCV L/H; blue) and heart rate (HR; green) with an RAMP (15 W/min) protocol ergometer are shown in the healthy volunteer (A) and patients with myocardial infarctions ([C]; a normal value of the HF, [D] a very low value of the HF, [E] a vacillated pattern of the HF). A power spectral analysis of RR intervals measured at 1000 Hz, quantified the power spectral densities of the HF and LF using the maximum entropy method. With updating the data every heartbeat, the HF and LF were visualized as these graphs without a delay during the CPX. B, The power spectrum density (PSD) in a healthy volunteer at every particular point during exercise: rest, warm‐up, warm‐up—ventilator threshold (VT), VT, VT—peak, recovery. The vertical and horizontal lines show the power spectrum density and frequency, respectively. CCV indicates coefficient of component variance; CPX, cardiopulmonary test; HF, high‐frequency component; L/H, the ratio of the LF to HF; 0W, warm‐up; VT, ventilatory threshold.
