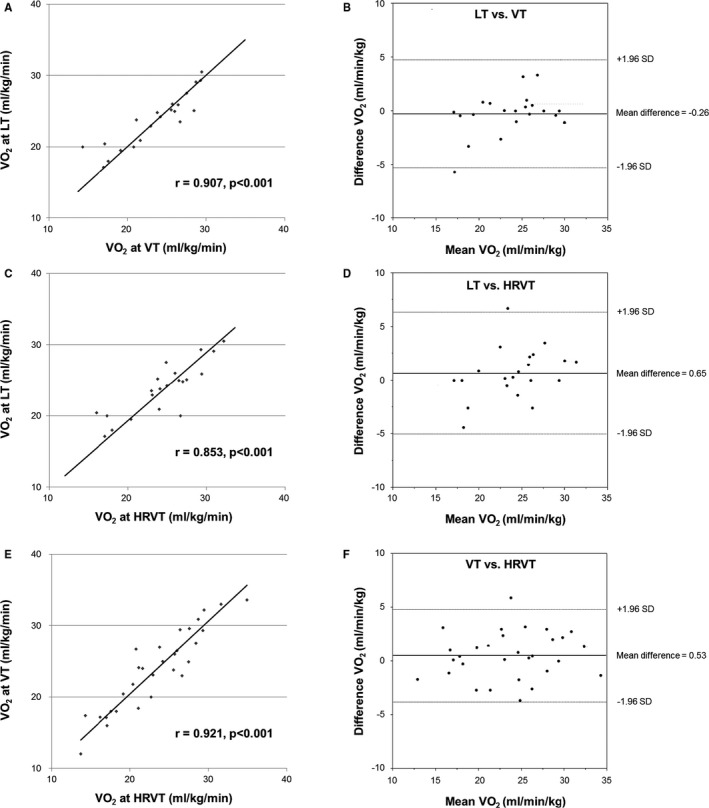
Figure 3.

Validity testing of the oxygen uptake (VO 2) at the HRVT, LT, and VT in healthy subjects (n=30). The graphs in the left panel show the relationship between each VO 2 at the heart rate variability threshold (HRVT), ventilator threshold (VT), and lactate threshold (LT) (A, C, and E). The graphs in the right panel show the Bland‐Altman plots (B, D, and F), which indicate the respective differences between each VO 2 at the HRVT, LT, and VT (y‐axis) for each individual against the mean of the VO 2 at the HRVT, LT, and VT (x‐axis). The dark lines in each Bland‐Altman plot represent a ±1.96 SD.
