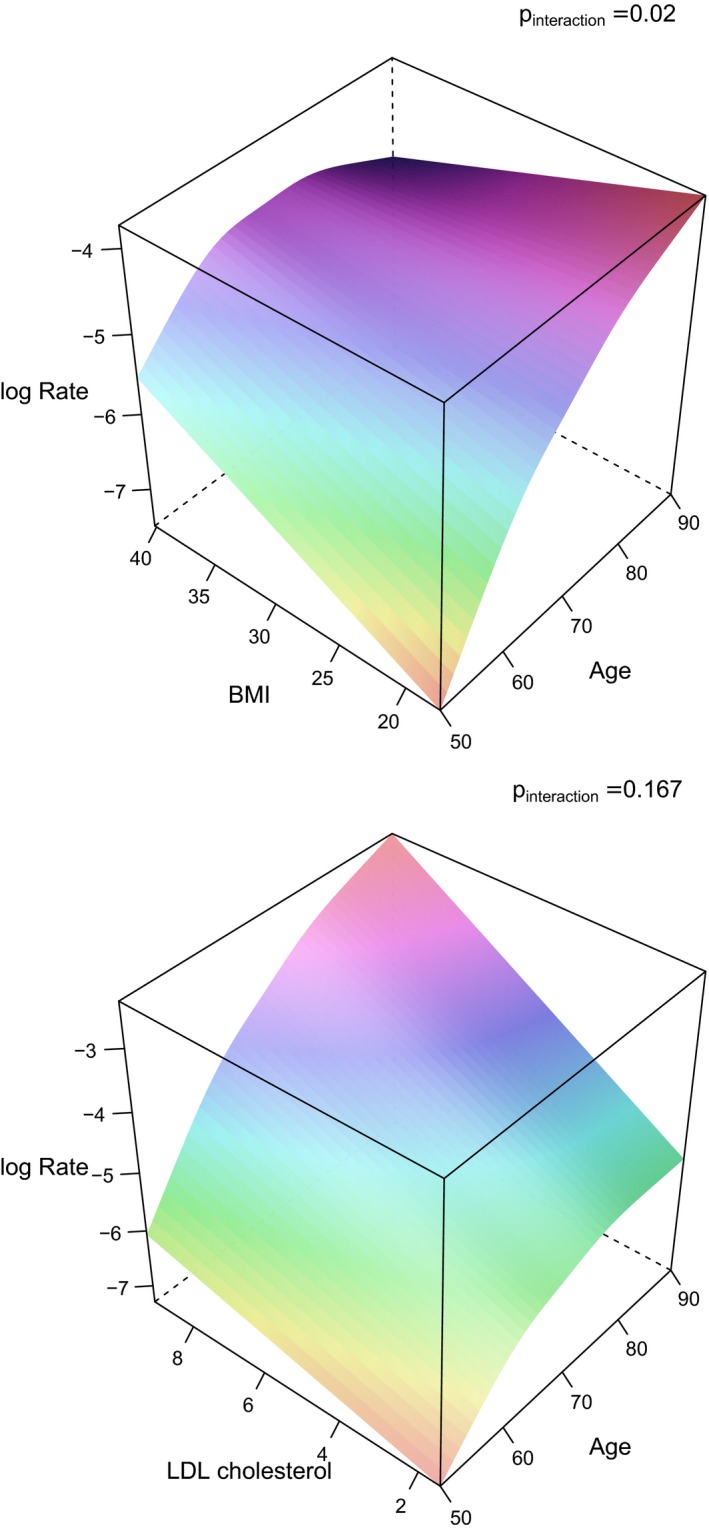
Figure 1.

3D graphs illustrating the impact of BMI and age on the incident rate (log rate) of myocardial infarction (upper panel), and in a similar way LDL‐cholesterol (in the lower panel). The P values for the interaction term between those risk factors and age regarding myocardial infarction are given in the graphs. 3D indicates 3‐dimensional; BMI, body mass index; LDL, low‐density lipoprotein.
