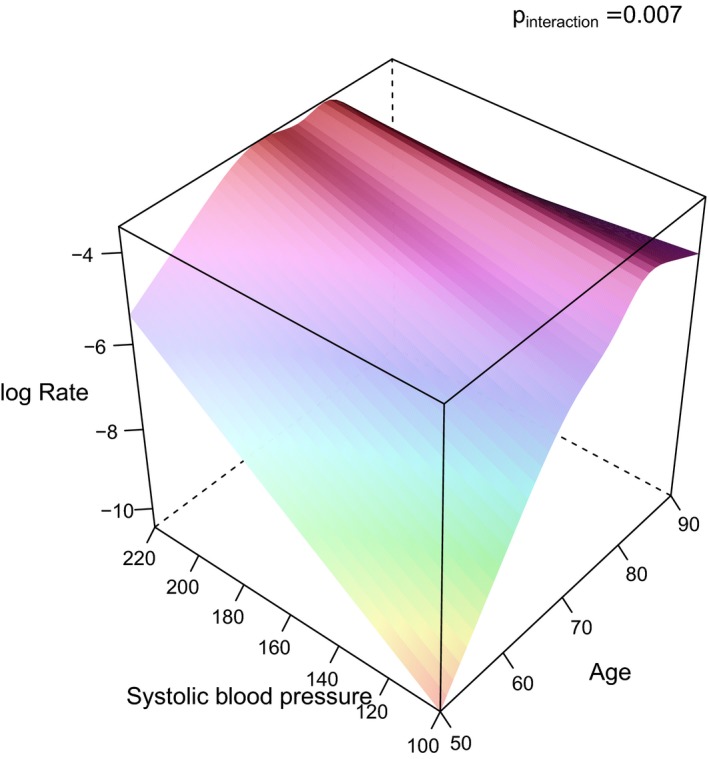
Figure 2.

3D graph illustrating the impact of systolic blood pressure and age on the incident rate (log rate) of ischemic stroke. The P values for the interaction term between systolic blood pressure and age regarding ischemic stroke is given in the figure. 3D indicates 3‐dimensional.
