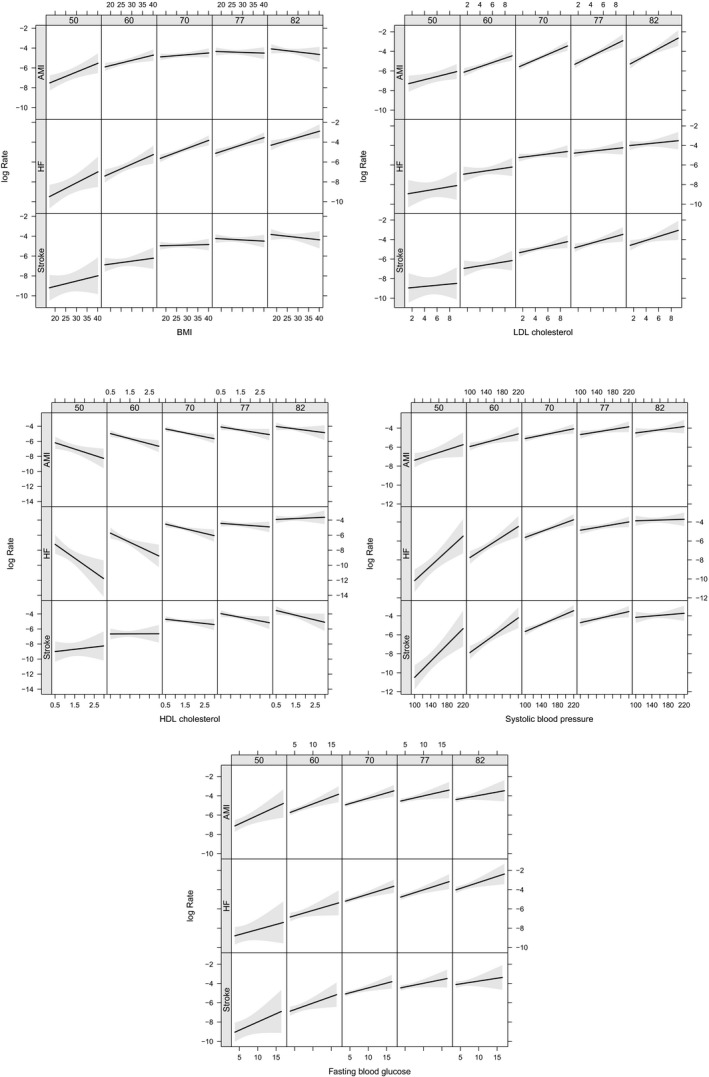
Figure 4.

2D graphs showing the relationships between (A) body mass index (BMI), (B) LDL and (C) HDL‐cholesterol, (D) systolic blood pressure (SBP), (E) fasting glucose and log incidence rate of myocardial infarction (AMI), heart failure (HF) and ischemic stroke at ages 50, 60, 70, 77 and 82 years. The grey areas represent the 95% confidence intervals. 2D indicates 2‐dimensional; HDL, high‐density lipoprotein; LDL, low‐density lipoprotein.
