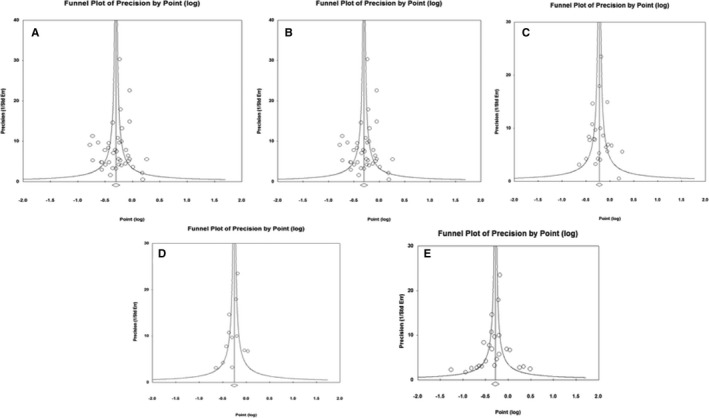
Figure 5.

Publication bias as assessed by funnel plots for all‐cause mortality in the primary analysis. A, All included studies. B, Studies performed in the general population vs studies performed in specific subpopulations. C, Unadjusted studies vs adjusted studies. D, PSM studies vs adjusted non‐PSM studies. E, PSM studies at 1‐year follow‐up vs PSM studies at end of follow‐up. PSM indicates propensity‐score matched.
