
Figure 2.
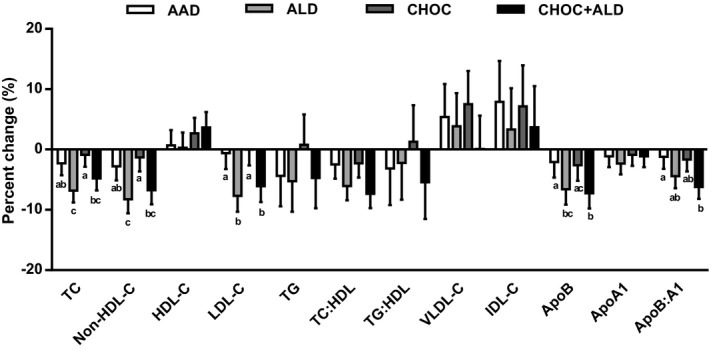
Percentage change in serum lipids, lipoproteins, and apolipoproteins in response to 4 diets. Percentage change was calculated from the baseline value of each diet period. The bars represent least‐squares means for n=31. The error bars represent SEMs. Statistical significance was assessed using the PROC MIXED procedure in SAS; mean values with different lowercase letters are significantly different, P<0.05. AAD indicates average American diet; ALD, almond diet; ApoA1, apolipoprotein A1; ApoB, apolipoprotein B; CHOC, chocolate diet; CHOC+ALD, chocolate and almond diet; HDL, high‐density lipoprotein; HDL‐C, HDL cholesterol; IDL‐C, intermediate‐density lipoprotein cholesterol; LDL‐C, low‐density lipoprotein cholesterol; TC, total cholesterol; and VLDL‐C, very‐low‐density lipoprotein cholesterol.