
Figure 4.
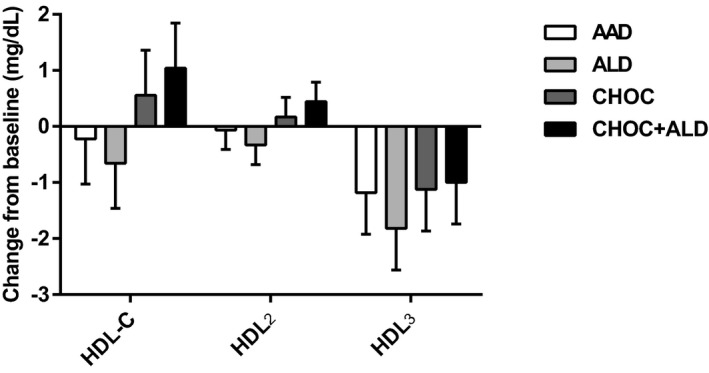
Change from baseline in high‐density lipoprotein cholesterol (HDL‐C) subclasses in response to 4 diets. The bars represent least‐squares means for n=31. The error bars represent SEMs. Statistical significance was assessed using the PROC MIXED procedure in SAS; no treatment effects occurred on HDL‐C subclasses, P>0.05. AAD indicates average American diet; ALD, almond diet; CHOC, chocolate diet; CHOC+ALD, chocolate and almond diet; HDL2, large HDL‐C particle; and HDL3, small HDL‐C particle.