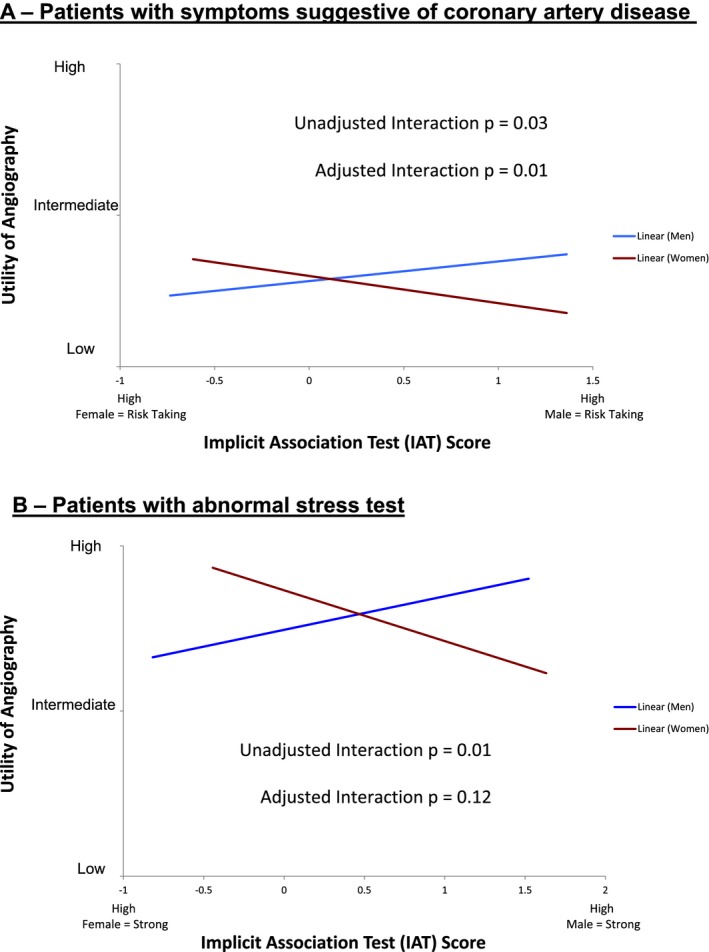
Figure 3.

The strength of angiography rating varied according to case patient gender and physician implicit gender bias. The x‐axis represents physician gender bias based on Implicit Association Test scores, and the y‐axis represents the extent to which angiography was rated as useful for the case vignette by the physician. The relationship between gender bias and angiography rating is indicated when the case patient was male (blue line) and female (red line). In unadjusted analysis, significant interactions were seen between gender bias and case gender; those with higher implicit gender bias on risk taking (A) or strength (B) rated angiography as less useful in women than men (unadjusted P<0.05 for interaction for both). After adjustment for perceived likelihood of coronary artery disease and physician specialty, the interaction between risk‐taking bias and patient gender on angiography usefulness remained significant (adjusted P=0.01 for interaction in panel A); however, the interaction with strength bias was no longer significant (adjusted P=0.12 in panel B).
