
Figure 2.
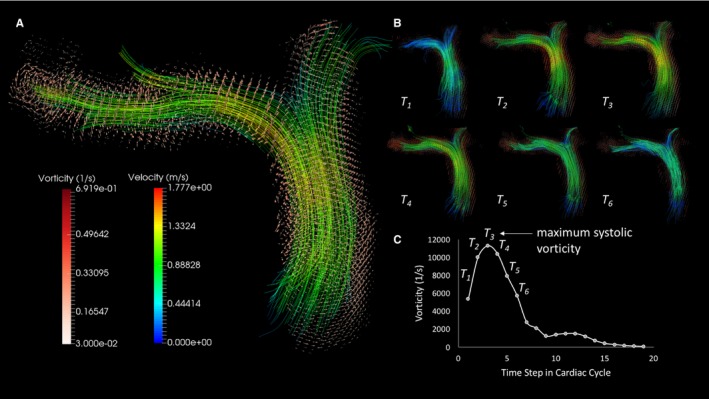
Vorticity visualization and quantification. A, Velocity streamlines in proximal pulmonary conduit vessels with superimposed vorticity vector field delineating the arterial luminal surface. B, Evolution of velocity and vorticity in pulmonary arteries in the systolic phase of the cardiac cycle. C, Reconstructed vorticity waveform has a similar shape to the classic flow curve with maximum systolic vorticity sampled in each case.