

Abstract
Background
End‐stage kidney disease is associated with increased arterial stiffness. Although correction of uremia by kidney transplantation (KTx) could improve arterial stiffness, results from clinical studies are unclear partly due to small sample sizes.
Method and Results
We conducted a systematic review and meta‐analysis of before‐after design studies performed in adult KTx patients with available measures of arterial stiffness parameters (pulse wave velocity [PWV], central pulse pressure [PP], and augmentation index) before and at any time post‐KTx. Mean difference of post‐ and pre‐KTx values of different outcomes were estimated using a random effect model with 95% confidence interval. To deal with repetition of measurement within a study, only 1 period of measurement was considered per study by analysis. Twelve studies were included in meta‐analysis, where a significant decrease of overall PWV by 1.20 m/s (95% CI 0.67‐1.73, I2=72%), central PWV by 1.20 m/s (95% CI 0.16‐2.25, I2=83%), peripheral PWV by 1.17 m/s (95% CI 0.17‐2.17, I2=79%), and brachial‐ankle PWV by 1.21 m/s (95% CI 0.66‐1.75, I2=0%) was observed. Central PP (reported in 4 studies) decreased by 4.75 mm Hg (95% CI 0.78–10.28, I2=50%). Augmentation index (reported in 7 studies) decreased by 10.5% (95% CI 6.9‐14.1, I2=64%). A meta‐regression analysis showed that the timing of assessment post‐KTx was the major source of the residual variance.
Conclusions
This meta‐analysis suggests a reduction of the overall arterial stiffness in patients with end‐stage kidney disease after KTx.
Keywords: arterial stiffness, augmentation index, kidney, pulse pressure, pulse wave velocity, transplantation
Subject Categories: Hypertension, Vascular Disease, Cardiovascular Disease, Transplantation
Clinical Perspective
What Is New?
This meta‐analysis shows that in patients with end‐stage kidney disease, there is a reduction of arterial stiffness after a successful kidney transplantation.
Part of this reduction is related to changes in mean arterial pressure and the timing of vascular assessment after kidney transplantation.
What Are the Clinical Implications?
The improvement of cardiovascular risk after kidney transplantation could partly be explained by the improvement of arterial stiffness.
Introduction
Patients with chronic kidney disease (CKD) have a higher risk of cardiovascular disease compared with the general population, even after adjustment for traditional cardiovascular disease risk factors.1, 2, 3 Arterial stiffness, a nontraditional cardiovascular disease risk factor, has been proposed to explain part of this excess cardiovascular risk.4, 5 Indeed, it has been reported in systematic review and meta‐analysis that a raise in aortic PWV by 1 m/s increases the total cardiovascular events, cardiovascular mortality, and all‐cause mortality risk, adjusted for age, sex, and other risk factors, by 14%, 15%, and 15%, respectively.6 Although the risk of cardiovascular disease is attenuated after kidney transplantation (KTx)7, the impact of KTx on arterial stiffness still remains unknown, mainly due to small‐sample studies.8, 9
Structural alterations in the media of the aortic wall result in increased stiffness, raised pulse pressure (PP) and myocardial workload, and reduced coronary perfusion.10 These structural abnormalities may occur through various phenomena including breaks in elastin lamellae, crosslinks of the elastin network, fibrosis, inflammation, and medial calcification.11, 12, 13, 14, 15, 16, 17, 18 However, it is not clear whether any single intervention in CKD patients can enhance the complex nature of the CKD‐related vascular remodeling. Because successful KTx may restore kidney function and improve a number of metabolic disorders involved in arterial stiffness19, 20, the reduction of arterial stiffness after KTx is plausible. Therefore, we conducted a systematic review and meta‐analysis to study the impact of KTx on arterial stiffness as measured by pulse wave velocity (PWV) and its central hemodynamic effects on central pulse pressure (PP) and augmentation index (AIx).
Methods
Study Design
We conducted a systematic review based on methodological recommendations from the Cochrane Handbook for Systematic Reviews of Interventions 21, on a registered protocol in Prospero (CRD42016045383) and reported according to the PRISMA (Preferred Reporting Items for Systematic Reviews and Meta‐Analyses) statement.22
Eligibility Criteria
We included in our systematic review before‐after design studies conducted in adult (age ≥18) end‐stage kidney disease patients who underwent KTx with functioning graft and with repeated measurements of arterial stiffness parameters. The outcomes of interest were arterial stiffness parameters including PWV (the clinical gold standard) and other indirect parameters such as central PP and increased wave reflection as measured by AIx11 (see Table 1 for details on population, intervention, comparators, and outcome).
Table 1.
Structured Question
| Terms of PICO | Definition of Terms |
|---|---|
| Population | Adult end‐stage kidney disease patients with functioning graft |
| Intervention | Kidney transplantation |
| Comparator | Pre‐KTx status (hemodialysis, peritoneal dialysis, not yet on dialysis) |
| Outcomes |
Primary outcome: PWV (any type) Secondary outcomes: central pulse pressure and augmentation index |
| Study design | Before and after design studies |
KTx indicates kidney transplant; PICO, population, intervention, comparator, outcome; PWV, pulse wave velocity.
Information Sources and Search Strategy
We performed a search using electronic databases (Medline, Cochrane Library, Embase, and the Web of Science) from their inception until January 2016. The search strategy is based on keywords related to the intervention (renal transplantation and synonyms) and the outcomes (arterial stiffness, its parameters, and their synonyms). A search strategy was first set for PubMed/Medline and Embase and then adapted to Cochrane Library and the Web of Science with no restriction. The search strategy established for PubMed/Medline is shown in Table 2. We then hand searched additional references from the reference lists of relevant articles and in gray literature (Google Scholar, thesis repositories including Thesis portal Canada, EtHOS, DART‐Europe E‐Thesis Portal, the National Library of Australia's Trove, and ProQuest Dissertations & Theses Global).
Table 2.
Search Strategy for PubMed/Medline
| Terms of PICOS | Terms and Synonyms | Connection |
|---|---|---|
|
Intervention (Kidney transplantation and synonyms) |
1. “Kidney Transplantation” [mesh] or 2. ((“Kidney” [TIAB] or “Renal” [TIAB]) and (“transplantation*” [TIAB] or “grafting*” [TIAB] or “replacement therap*” [tiab])) |
3. =1 OR 2 |
| Outcomes (arterial stiffness parameters) |
4. “Vascular Stiffness” [mesh] or 5. ((“vascular” [TIAB] or “arterial” [TIAB] or “aortic” [TIAB]) AND (“Stiffness*” [TIAB])) or 6. “Pulse Wave Analysis” [mesh] or 7. ((“pulse wave” [tiab] and (“velocit*” [tiab] or “analys*” [tiab])) or 8. “augmentation index” or 9. “AIx” or 10. “pulse pressure” |
11. =4 to 10 connected by OR |
| Combination | 12. 3 AND 11 | |
| Extraction of animal studies | 13. exp animals/not humans.sh. | |
| Exclusion of animal studies from the results | 14. 12 Not 13 |
Study Selection and Data Management
After removing duplicates of identified records from our search strategies using EndNote (version x7.2.1, Thomson Reuters, New York, 1988‐2014), 2 independent reviewers (A.S. and C.F.) screened each study by title and abstract using standardized and pilot‐tested screening forms. Full text was also screened when title and abstract were not enough for inclusion of a study in the review under the eligibility criteria described above.
Data Extraction and Risk of Bias Assessment
Data of included studies were then independently extracted using a standardized and pilot‐tested data extraction form. In each step discrepancies between the 2 reviewers were resolved through consensus or with the involvement of a third reviewer (M.P.D.), as required. Extracted data included information on the study, characteristics of the study population and intervention, pre‐KTx therapies, and arterial stiffness parameters from eligible studies.
Two authors (A.S. and M.P.D.) assessed the quality (risk of bias) in included studies with a tool developed by the National Health Institute to assess the quality in before‐after design studies.23 Likewise, we assessed conflicts of interest using information on the source of funding for each study.
Data Synthesis
We analyzed and summarized the study data with Review Manager Software (Revman, Computer program, Version 5.3,The Nordic Cochrane Centre, The Cochrane Collaboration, Copenhagen, Denmark, 2014). To assess the association between KTx and arterial stiffness, we considered the mean difference between arterial stiffness outcomes (PWV [overall, central, peripheral, and brachial‐ankle], central PP, and AIx) assessed after KTx and before KTx as effect size. PWV was first analyzed globally regardless of the arterial territory or the period of assessment (overall PWV). Second, we considered a posteriori each arterial territory reported as an outcome: central PWV (composed of carotid‐femoral PWV and aorta‐femoral PWV), peripheral PWV (composed of carotid‐radial PWV and femoral‐distal PWV), and brachial‐ankle PWV. Two global analyses were performed for each outcome for which more than 2 measurements were performed within a study. Indeed, we included either the earliest measure after the first week (first global analysis) or the latest measure within 1 year (second global analysis). Because we anticipated a potential heterogeneity between the included studies, we estimated the pooled mean difference and its 95% confidence interval using a random‐effects model with inverse variance method.24
Statistical heterogeneity was assessed using the Higgins I2 and interpreted as low between 0% and 30%, moderate between 30% and 60%, considerable between 60% and 80%, and substantial from 80% and above.21, 25
For each outcome of interest, we explored the publication bias using the Begg rank correlation test and the Egger regression as appropriate given the known limitations of these methods26 using an available macro for SAS.27 All tests of statistical inference were 2‐sided with an α of 5%.
Subgroup Analyses, Meta‐Regression, and Sensitivity Analyses
Subgroup analyses were performed for each outcome according to the period of assessment, which was decided in post hoc analysis using the most used period (≤3 months, at 6 months, and at 12 months post‐KTx).
A meta‐regression was performed in order to quantify the amplitude of influence of some potential factors modifying the effect size estimated in meta‐analysis. We considered period of assessment, arterial territory of PWV, and changes in mean arterial pressure (ΔMAP) as independent variables. Each of these independent variables was analyzed alone in a univariate meta‐regression. Then, ΔMAP was analyzed in a multivariate meta‐regression with period of assessment and/or type of PWV as covariates. All meta‐regressions were performed in SAS Version 9.4 (Copyright © 2015, SAS Institute Inc, Cary, NC) using general linear mixed model with random effects.28 MAP was estimated by the Lian formula (MAP=2/3 DBP+1/3 SBP) in studies that did not report it but for which systolic and diastolic brachial blood pressures were available. Changes in MAP were estimated by computing the absolute difference between the MAP post‐KTx and MAP pre‐KTx. Sensitivity analyses in meta‐analysis were performed by removing studies 1 by 1 to see the impact on the estimated pooled effect size and its statistical heterogeneity. Likewise, sensitivity analyses were performed in meta‐regression by removing studies with poor quality (high risk of bias).
Grading of the Evidence
Two reviewers assessed the overall quality of evidence for each outcome using the GRADE tool.29 Five domains were considered to assess the quality of evidence: quality (risk of bias), inconsistency, indirectness and imprecision, which can be considered serious or very serious, and publication bias, which can be undetected, likely, or very likely. The quality of evidence of observational studies begins low. Although, grading upward may be warranted if the magnitude of the treatment effect is very large, if there is evidence of a dose‐response relation, or if all plausible biases would decrease the magnitude of an apparent treatment effect.29
Results
Study Selection and Description of Included Studies
From the 868 citations identified through electronic databases, we included 12 unique studies in meta‐analysis (see details in Figure 1), with sample sizes ranging from 18 to 168 observations (9‐84 pairs). All studies were quasiexperimental with before‐after design study and published in English between 2003 and 2016. Seven studies8, 9, 20, 30, 31, 32, 33 assessed aortic PWV (central), 3 studies8, 9, 34 assessed peripheral PWV (carotid‐radial or femoral‐distal PWV), and 4 studies35, 36, 37, 38 assessed brachial‐ankle PWV. Two studies8, 9 assessed both central and peripheral PWV, and 3 studies20, 33, 35 used multiple periods of assessment. Central PP was reported in 4 studies8, 9, 20, 32 and AIx in 7 studies.8, 9, 20, 31, 32, 33, 34 All studies were considered to have a good quality (low risk of bias), except 1 considered as fair quality (moderate risk of bias) and 230, 34 adjudicated as poor quality (high risk of bias). Tables 3 and 4 show the detailed characteristics of the included studies.
Figure 1.
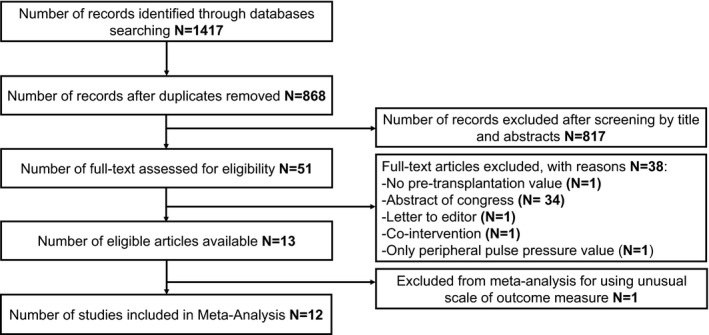
Flow diagram. The figure shows the selection process for the studies included in the meta‐analysis.
Table 3.
Characteristics of Individual Studies, Population, and Intervention
| First Author, Year | Country | Sample Size | Age (y) | Male (%) | Diabetes Mellitus(%) | HTN (%) | CVD (%) | Living Donor (%) | IS (%) | Cr (μmol/L)a | Quality of Study |
|---|---|---|---|---|---|---|---|---|---|---|---|
| Covic, 200334 | Romania | 20 | 49 | 50 | NR | 85 | NR | 100 | 100C | NR | Poor |
| Zoungas, 20049 | Australia | 36 | 46±11 | 75 | 22 | 78 | 11 | 8 | 33T/64C/3O | 143±4712Mo | Good |
| Keven, 200830 | Turkey | 28 | 34±9 | 68 | 4 | 68 | NR | 71 | 29C/71T | 106±2712Mo | Poor |
| Nishioka, 200838 | Japan | 9 | 42±6 | 78 | NR | NR | NR | 100 | 44C/56T | 124±1812Mo | Good |
| Ignace, 20118 | Canada | 52 | 50±13 | 71 | 33 | NR | 21 | 12 | 100T | 120±403Mo | Good |
| Bachelet‐Rousseau, 201131 | France | 39 | 56 (49‐60) | 54 | 18 | 92 | 5 | NR | 56C/28 T/15O | 124 (106‐141)6Mo | Good |
| Hornum, 201132 | Denmark | 40 | 38±13 | 70 | 0 | NR | NR | 93 | 5S/65C/30T/5O | 130±612Mo | Good |
| Hotta, 201236 | Japan | 58 | 41±12 | 59 | NR | NR | NR | NR | 100T | NR | Good |
| Kaur, 201320 | India | 23 | 36±9 | 96 | NR | 100 | NR | 100 | 100T |
66±243Mo
70±226Mo |
Good |
| Kovacs, 201333 | Hungary | 17 | 46±12 | 59 | NR | NR | NR | NR | NR | 161±90<1Mo | Fair |
| Kim, 201537 | Korea | 84 | 45±12b | 54b | NR | NR | 6b | NR | 6b C/94b T | NR | Good |
| Ro, 201635 | Korea | 67 | 46±10 | 52 | NR | NR | NR | NR | 95T |
106±356Mo
97±2712Mo |
Good |
Results are expressed as mean±SD, median [25th‐75th], or number. <1Mo, <1 month after KTx; 12Mo, 3 months after KTx; 6Mo, 6 months after KTx; C, 12 year after KTx; 3Mo, cyclosporin; Cr, serum creatinine; CVD, cardiovascular disease; HTN, hypertension; IS, immunosuppressive medication; KTx, kidney transplantation; NR, not reported; O, other immunosuppressive medication; S, sirolimus; T, tacrolimus.
Creatinine values in mg/dL were converted into μmol/L.
Results are based on n=171.
Table 4.
Characteristics of Individual Studies by Arterial Stiffness Parameters
| First Author, Year | Sample Size | PWV | PP | AIx | Follow‐Up (Months) |
|---|---|---|---|---|---|
| Covic, 200334, a | 20 | Peripheral | NR | Central | 3 |
| Zoungas, 20049 | 36 | Central/Peripheralb | Centrald | Centrald | 12 |
| Keven, 200830 | 28 | Central | NR | NR | 12 |
| Nishioka, 200838 | 9 | BA | NR | NR | 12 |
| Ignace, 20118 | 52 | Central/Peripheral | Central | Centrale | 3 |
| Bachelet‐Rousseau, 201131 | 39 | Central | NR | Centrald | 6 |
| Hornum, 201132 | 40 | Central | Central | Central | 12 |
| Hotta, 201236 | 58 | BA | NR | NR | 6 |
| Kaur, 201320 | 23 | Central | Central | Central | 3, 6 |
| Kovacs, 201333 | 17 | Centralc | Peripheral | Central | <1 |
| Kim, 201537 | 84 | BA | Peripheral | NR | 12 |
| Ro, 201635 | 67 | BA | Peripheral | NR | 6, 12, 24 |
Central PWV are carotid‐femoral PWV; peripheral PWV are carotid‐radial PWV; a central PP and AIx are radial unless indicated otherwise. AIx indicates augmentation index; BA, brachial‐ankle PWV; NR, not reported; PP, pulse pressure; PWV, pulse wave velocity.
Mean arterial stiffness was not reported in the study.
Femoral‐distal PWV.
Aortic PWV.
Carotid site profile.
Heart rate–adjusted central augmentation index.
Pulse Wave Velocity
Overall PWV
Analyses of overall PWV regardless of the vascular territory, taking into account either the earliest measure or the latest measure within a study, showed globally a significant reduction by 1.17 m/s (0.64‐1.71) and by 1.20 m/s (0.67‐1.73), respectively, with considerable heterogeneity (I2=72; Figures 2 and 3).
Figure 2.
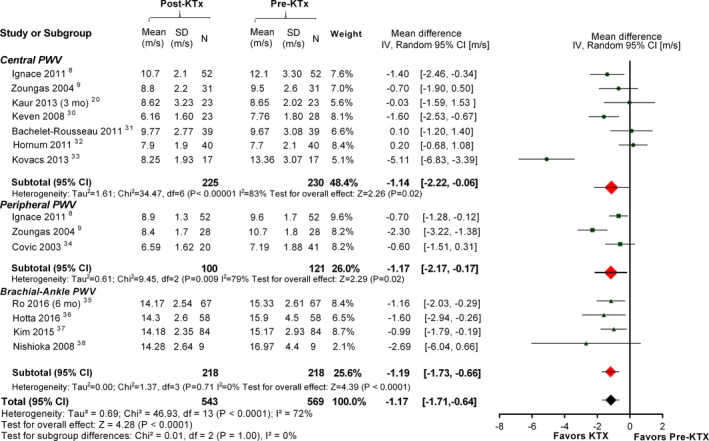
First global analysis of pulse wave velocity. Pulse wave velocity (PWV) is analyzed overall and according to the arterial territory. In the first global analysis, we included the earliest measure reported in studies using multiple measurements (studies from Kaur at 3 months and Ro at 6 months). CI indicates confidence interval; mo, months.
Figure 3.
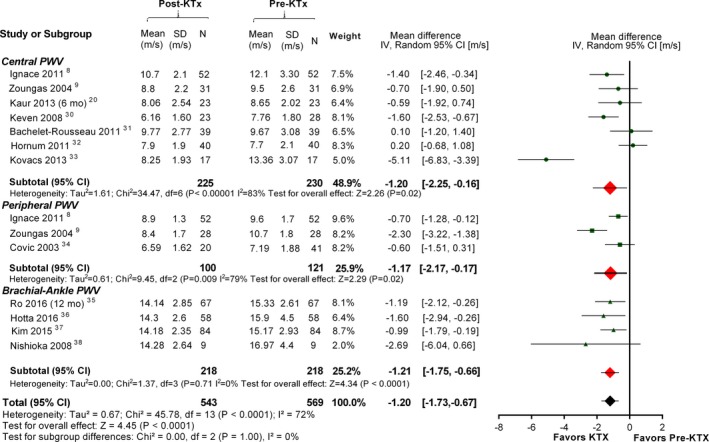
Second global analysis of pulse wave velocity. Pulse wave velocity (PWV) is analyzed overall and according to the arterial territory. In the second global analysis, we included the latest measure reported in studies using multiple measurements (studies from Kaur at 6 months and Ro at 12 months). CI indicates confidence interval; mo, months.
Almost all studies were adjudicated to have a good or fair quality, except the study from Keven30 and that from Covic34 in which the numbers of participants before and after KTx were different (poor quality). When those studies were excluded in sensitivity analyses, overall PWV remained significantly decreased globally by 1.20 m/s (0.57‐1.83, I2=75%) and 1.23 m/s (0.61‐1.85, I2=75%) for the earliest measure and latest measure within a study, respectively (Table 5). While remaining significantly decreased, the statistical heterogeneity of overall PWV was reduced from considerable to moderate when the study from Kovacs33 was excluded and to low when the 2 studies from Zoungas9 and Kovacs33 were excluded (Table 5).
Table 5.
Main and Sensitivity Global Analyses of Arterial Stiffness Outcomes
| Outcomes | N (Sample) | Global 1 Mean Difference (95% CI) | I2 | N (Sample) | Global 2 Mean Difference (95% CI) | I2 |
|---|---|---|---|---|---|---|
| Overall PWV | 14 (1112) | −1.17 (−1.71 to −0.64) | 72% | 14 (1112) | −1.20 (−1.73 to −0.67) | 72% |
| 12 (1000)a | −1.20 (−1.83 to −0.57)a | 75%a | 12 (1000)a | −1.23 (−1.85 to −0.61)a | 75%a | |
| 13 (1078)b | −0.95 (−1.36 to −0.54)b | 52%b | 13 (1078)b | −0.98 (−1.38 to −0.58) | 50%b | |
| 12 (1022)c | −0.82 (−1.17 to −0.47)c | 29%c | 12 (1022)c | −0.84 (−1.17 to −0.50)c | 25%c | |
| Central PWV | 7 (455) | −1.14 (−2.22 to −0.06) | 83% | 7 (455) | −1.20 (−2.25 to −0.16) | 83% |
| 6 (404)d | −1.07 (−2.36 to 0.22)d | 85%d | 6 (404)d | −1.15 (−2.39 to 0.10)d | 84%d | |
| 6 (421)b | −0.62 (−1.31 to 0.07)b | 56%b | 6 (421)b | −0.68 (−1.34 to −0.03)b | 53%b | |
| Peripheral PWV | 3 (221) | −1.17 (−2.17 to −0.17) | 79% | 0 | NA | NA |
| 2 (160)e | −1.46 (−3.03 to 0.11)e | 88%e | 0 | NA | NA | |
| Brachial‐ankle PWV | 4 (436) | −1.19 (−1.73 to −0.66) | 0% | 4 (436) | −1.21 (−1.75 to −0.66) | 0% |
| Central PP | 4 (302) | −4.03 (−8.56 to 0.50) | 43% | 4 (302) | −4.75 (−10.28 to 0.78) | 50% |
| 3 (230)f | −6.04 (−9.90 to −2.18)f | 0%f | 3 (230)f | −7.02 (−11.21 to −2.82)f | 18%f | |
| AIx | 7 (465) | −10.03 (−13.40 to −6.66) | 61% | 7 (465) | −10.50 (−14.09 to −6.90) | 64% |
| 6 (404)c | −10.38 (−14.66 to −6.11)c | 67%c | 6 (404)c | −10.96 (−15.54 to −6.39)c | 70%c | |
| 6 (431)b | −8.76 (−11.50 to −6.03)b | 37%b | 6 (431)b | −9.20 (−12.30 to −6.10)b | 49%b | |
| 5 (353)g | −9.77 (−12.07 to −7.48)g | 0%g | 5 (353)g | −10.13 (−12.47 to −7.78)g | 0%g |
Global 1 is the analysis including the earliest measurement for studies using multiple measurements; Global 2 is the analysis including the latest measurement for studies using multiple measurements. AIx indicates augmentation index; CI, confidence interval; N, number of studies included in analysis; NA, not applicable; PP, pulse pressure; PWV, pulse wave velocity; Sample, number of participants.
Sensitivity analysis excluding the study from Kovacs33.
Sensitivity analysis excluding the study from Keven30.
Sensitivity analysis excluding the study from Covic34.
Sensitivity analysis excluding the study from Zoungas9.
In subgroup analysis according to the period of assessment post‐KTx, overall PWV decreased at ≤3, 6, and 12 months post‐KTx, with substantial, low, and considerable heterogeneity, respectively. Although it remained significant in sensitivity analyses, the statistical heterogeneity of overall PWV effect size was reduced to low at 3 months or less and at 12 months post‐KTx (Table 6). Publication bias was likely according to Egger regression but unlikely with Begg rank correlation. The overall strength of evidence was considered to be low for overall PWV (Tables 7 and 8).
Table 6.
Subgroup and Sensitivity Analyses of Arterial Stiffness Outcomes According to the Period of Assessment
| Outcomes | ≤3 Months Post‐KTx | 6 Months Post‐KTx | 12 Months Post‐KTx | ||||||
|---|---|---|---|---|---|---|---|---|---|
| N (Sample) | Mean Difference (95% CI) | I2 | N (Sample) | Mean Difference (95% CI) | I2 | N (Sample) | Mean Difference (95% CI) | I2 | |
|
Overall PWV |
5 (349) | −1.43 (−2.61 to −0.24) | 84% | 4 (374) | −0.86 (−1.53 to −0.19) | 24% | 7 (569) | −1.16 (−1.83 to 0.48) | 66% |
| 4 (315)a | −0.74 (−1.17 to −0.31)a | 0%a | 3 (296)b | −1.13 (−1.77 to −0.49)b | 0%b | 6 (489)c | −1.41 (−1.92 to −0.91)c | 28%c | |
| 3 (254)d | −0.79 (−1.34 to −0.24)d | 12%d | 0 | NA | NA | 5 (433)e | −1.18 (−1.64 to −0.72)e | 0%e | |
|
Central PWV |
3 (184) | −2.14 (−4.73 to 0.45) | 90% | 2 (124) | −0.24 (−1.17 to 0.69) | 0% | 3 (193) | −0.69 (−1.81 to 0.43) | 74% |
| 2 (150)a | −0.84 (−2.16 to 0.48)a | 51%a | 0 | NA | NA | 2 (142)f | −0.15 (−1.01 to 0.71)f | 29%f | |
|
Peripheral PWV |
2 (165) | −0.67 (−1.16 to −0.18) | 0% | 0 | NA | NA | 1 (56) | −2.30 (−3.22 to −1.38) | NA |
|
Brachial‐Ankle PWV |
0 | NA | NA | 2 (250) | −1.29 (−2.02 to −0.56) | 0% | 3 (186) | −1.13 (−1.72 to −0.53) | 0% |
| Central PP | 2 (150) | −6.64 (−11.48 to −1.80) | 0% | 1 (46) | −11.60 (−18.55 to −4.65) | NA | 2 (152) | −1.22 (−9.05 to 6.60) | 66% |
| AIx | 3 (184)g | −12.16 (−18.45 to −5.87)g | 69%g | 2 (124) | −8.06 (−19.07 to 2.95) | 85% | 2 (142) | −11.79 (−16.36 to 7.23) | 0% |
| 3 (211)a | −9.09 (−11.75 to −6.43)a | 0%a | 0 | NA | NA | 0 | NA | NA | |
| 2 (150)d | −8.99 (−12.63 to −5.35)d | 0%d | 0 | NA | NA | 0 | NA | NA | |
AIx indicates augmentation index; KTx, kidney transplant; N, number of studies included; NA, not applicable; note that I2=NA when there is only 1 study in a subgroup; PP, pulse pressure; PWV, pulse wave velocity; Sample, number of participants included.
Sensitivity analysis excluding the study from Kovacs.33
Sensitivity analysis excluding the study from Bachelet‐Rousseau31.
Sensitivity analysis excluding the study from Hornum32.
Sensitivity analysis excluding the study from Keven30.
Sensitivity analysis excluding the study from Covic34.
Table 7.
Test for Publication Bias in the Estimate of Pulse Wave Velocity, Central Pulse Pressure, and Augmentation Index
| Parameters | Outcomes | Egger OLS Regression (P) | Begg Rank Correlation (Predictor=Variance) (P) | Begg Rank Correlation (Predictor=Sample Size) (P) |
|---|---|---|---|---|
| PWV | Overall1 | 0.002* | 0.198 | 0.492 |
| Overall2 | 0.002* | 0.232 | 0.492 | |
| Central1 | 0.017* | 0.160 | 0.253 | |
| Central2 | 0.017* | 0.160 | 0.253 | |
| Peripheral | 0.515 | 0.661 | 0.661 | |
| Brachial‐Ankle1 | 0.187 | <0.001* | <0.001* | |
| Brachial‐Ankle2 | 0.188 | <0.001* | <0.001* | |
| Central PP | Global 1 | 0.359 | 0.136 | 1.000 |
| Global 2 | 0.258 | 0.136 | 1.000 | |
| AIx | Global 1 | 0.072 | <0.001* | 0.045* |
| Global 2 | 0.077 | <0.001* | 0.148 |
Publication bias is assessed by the Egger regression test and the Begg rank correlation. *: Publication bias is likely according to a test when the P value is less than 0.05. The number 1 indicates the analysis including the earliest measurement for studies reporting multiple measures. The number 2 indicates the analysis including the latest measurement for studies reporting multiple measures. AIx indicates augmentation index; OLS, Ordinary Least Squares; PP, pulse pressure; PWV, pulse wave velocity; Sample, number of participants included.
Table 8.
Summary of Grading the Evidence of Findings in PWV, Central PP, and AIx: Kidney Transplantation Compared to Pretransplantation for Reduction of Arterial Stiffness
| Intervention: Kidney Transplantation; Comparison: Pretransplantation | |||||
|---|---|---|---|---|---|
| Outcomes | Anticipated Absolute Effects (95% CI)a | No. of Observations (Studies) | Quality of the Evidence (GRADE) | Comments | |
| Risk Pre‐KTx | Risk Post‐KTx | ||||
| Overall PWV at any period post‐ KTx | The mean PWV at any period post‐KTx was 0 m/s |
The mean difference in overall PWV at any period post‐KTx was 1.17 m/s lower (1.71 lower to 0.64 lower) Or 1.20 m/s lower (1.73 lower to 0.67 lower) |
1112 observations (14 observational studies) |
Low | Publication bias was likely according to Egger regression but unlikely with Begg rank correlation. Almost all studies were at good or fair quality for PWV except 2 with poor quality (high risk of bias). The results were consistent in subgroup analysis and when excluding studies with poor quality. |
| Central PWV at any period post‐KTx | The mean PWV at any period post‐KTx was 0 m/s |
The mean difference in central PWV at any period post‐KTx was 1.14 m/s lower (2.22 lower to 0.06 lower) or 1.20 m/s lower (2.25 lower to 0.16 lower) |
455 observations (7 observational studies) |
Very Low | Publication bias was likely according to Egger regression but unlikely with Begg rank correlation. Almost all studies were at good or fair quality except 1 with poor quality. The results were inconsistent in subgroup analysis and when studies with poor quality were excluded. |
| Peripheral PWV at any period post‐KTx | The mean PWV at any period post‐KTx was 0 m/s |
The mean difference in peripheral PWV at any period post‐KTx was 1.17 m/s lower (2.17 lower to 0.17 lower) or 1.46 m/s lower (3.03 lower to 0.11 upper) |
221 observations (3 observational studies) or 160 observations (2 observational studies) |
Very Low | Publication bias was unlikely. Almost all studies were at good or fair quality for PWV except 1 with unclear risk of bias. The results were inconsistent when the study with unclear risk of bias was excluded. |
| Brachial‐Ankle PWV at any period post‐KTx | The mean PWV at any period post‐KTx was 0 m/s |
The mean difference in branchial‐ankle PWV at any period post‐KTx was 1.19 m/s lower (1.73 lower to 0.66 lower) or 1.21 m/s lower (1.75 lower to 0.66 lower) |
436 observations (4 observational studies) |
Low | All studies were at good or fair quality for PWV. The results were consistent in subgroup analysis; publication bias was likely with both tests. |
| Central PP at any period post‐KTx |
The mean central PP at any period post‐KTx was 0 mm Hg |
The mean difference in central PP at any period post‐KTx was 4.03 mm Hg lower (8.56 lower to 0.50 upper) or 4.75 mm Hg lower (10.28 lower to 0.78 lower) |
302 observations (4 observational studies) |
Very Low | Publication bias was unlikely according to Egger's regression and Begg's rank correlation. All studies were at good or fair quality for central PP. Results were inconsistent in subgroup analysis. |
| AIx at any period post‐ KTx | The mean AIx at any period post‐KTx was 0% |
The mean difference in AIx post‐KTx was 10.03% lower (13.40 lower to 6.66 lower) or 10.50% lower (14.09 lower to 6.90 lower) |
465 observations (7 observational studies) |
Low | Publication bias was unlikely with both tests. Almost all studies were at good or fair quality, except 1 with poor quality. Results were consistent in subgroup analysis and when the study with poor quality was excluded. |
GRADE Working Group grades of evidence: high quality, we are very confident that the true effect lies close to that of the estimate of the effect; moderate quality, we are moderately confident in the effect estimate—the true effect is likely to be close to the estimate of the effect, but there is a possibility that it is substantially different; low quality, our confidence in the effect estimate is limited—the true effect may be substantially different from the estimate of the effect; very low quality, we have very little confidence in the effect estimate—the true effect is likely to be substantially different from the estimate of effect. AIx indicates augmentation index; CI, confidence interval; KTx, kidney transplant; PP, pulse pressure; PWV, pulse wave velocity.
The risk in the intervention group (and its 95% confidence interval) is based on the assumed risk in the comparison group and the relative effect of the intervention (and its 95% CI).
Central PWV
Analyses of central PWV, considering either the earliest measure or the latest measure within a study, globally showed a significant decrease at any period of assessment (Table 5). Almost all studies were adjudicated to have a good or fair quality for central PWV except the study from Keven30, which was adjudicated to have a poor quality because the number of participants before and after KTx were different. When that study was excluded from the sensitivity analysis, the decrease in global central PWV was no longer significant (Table 5). The statistical heterogeneity of central PWV was reduced from substantial to moderate (56% and 53%) after exclusion of the study from Kovacs.33 However, this reduction was significant only in regard to the latest measure within a study by 0.68 m/s (0.03‐1.34, I2=53%) (Table 5). Publication bias was likely according to Egger regression but unlikely with Begg rank correlation. The overall strength of evidence was considered as very low for central PWV (Tables 7 and 8).
Peripheral PWV
Only 1 global analysis was performed in peripheral PWV because no studies reported repeated measurements of peripheral PWV. We observed a significant decrease at any period of assessment (Table 5). All studies except that from Covic34 were adjudicated to have a good quality. When the latter was excluded from the sensitivity analysis, only 2 studies remained, and the reduction was no longer statistically significant (Table 5). Publication bias was unlikely with both tests. The overall strength of evidence was considered very low for peripheral PWV (Tables 7 and 8).
Brachial‐Ankle PWV
Analyses of brachial‐ankle PWV, considering either the earliest measure or the latest measure within a study, showed globally a significant decrease at any period of assessment with low heterogeneity (Table 5). All studies were adjudicated to have a good quality for brachial‐ankle PWV, and publication bias was unlikely according to Egger regression but likely according to Begg correlation. The overall strength of evidence was considered to be low for brachial‐ankle PWV (Tables 7 and 8).
Subgroup Analysis of Vascular Territory With Regard to Period of Assessment
Subgroup analyses, although limited due to the small number of studies reporting central PWV (7), peripheral PWV (3), and brachial‐ankle PWV (4), were performed according the period of assessment post‐KTx and reported in Table 6.
Central Pulse Pressure
Analyses of central PP at any period of assessment, considering either the earliest measure or the latest measure within a study, was not significantly reduced (Table 5). In sensitivity analysis, after exclusion of the study from Zoungas9 in which heart rate had significantly declined after KTx, central PP significantly decreased by 6.0 mm Hg (2.2‐9.9, I2=0%) and 7.0 mm Hg (2.8‐11.2, I2=18%), respectively, when considering the earliest or the latest measure within a study. The statistical heterogeneity was also considerably reduced to low (Table 5).
Subgroup analyses of central PP, although limited by the small number of studies, were performed with regard to the period of assessment post‐KTx (Table 6). Publication bias was unlikely according to both tests. All studies were adjudicated to have a good quality for central PP. The overall strength of evidence was considered as very low for central PP (Tables 7 and 8).
Augmentation Index
The AIx at any period of assessment post‐KTx, considering either the earliest measure or the latest measure within a study, declined by 10.0% (6.7‐13.4, I2=61%) and 10.5% (6.9‐14.1, I2=64%), respectively (Table 5). All studies were adjudicated to have a good quality for AIx except the study from Covic,34 which was considered to have poor quality. When the latter was excluded, AIx remained significantly decreased globally (Table 5). Although it remained significantly reduced, the statistical heterogeneity of both global effect sizes of AIx was considerably reduced in sensitivity analysis. Although limited, subgroup analyses were performed according to the period of assessment (Table 6). Publication bias was unlikely according to both tests. The overall strength of evidence was considered as low for AIx (Tables 7 and 8).
Meta‐Regression
Pulse Wave Velocity
The between‐study variance in PWV was mostly explained by the period of assessment (68% when considering all studies except Covic34 and 80% when studies from both Covic34 and Keven30 were excluded in univariate analysis). The percentage of variance increased to 78% and 87%, respectively, when period of assessment and type of PWV were considered in the same model (Table 9). In univariate meta‐regression, only ΔMAP was associated with the effect size of PWV observed. In the model including all studies except the 1 from Covic,34 in which MAP was not available, this association was no longer significant with adjustments for either type of PWV or period of assessment. In the model excluding both studies from Covic34 and Keven,30 the association between ΔMAP and the effect size of PWV remained significant when adjusting for the type of PWV but was no longer significant when adjusting for the period of assessment (Figure 4).
Table 9.
Estimation of Study Residual Variance According to the Arterial Stiffness Parameters
| Parameters | PWV | Central PP | AIx | |
|---|---|---|---|---|
| Model 1 | Model 2 | |||
| Period of assessment | 68% | 80% | 70% | 63% |
| Type of PWV | 1% | 3% | … | … |
| ΔMAP | 1% | 37% | 76% | 1% |
| Type of PWV+ΔMAP | 4% | 37% | … | … |
| Period of assessment+ΔMAP | 53% | 79% | NE | 62% |
| Period of assessment+type of PWV | 78% | 87% | … | … |
AIx indicates augmentation index; Model 1, including all studies except Covic34; Model 2, including all studies except Covic34 and Keven30; NE, not estimated; PP, pulse pressure; PWV, pulse wave velocity; Type of PWV, central, peripheral, or brachial‐ankle PWV; ΔMAP, mean arterial pressure after transplantation–mean arterial pressure before transplantation.
Figure 4.
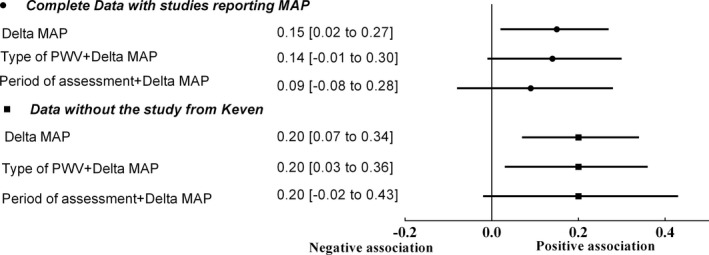
Association between change in mean arterial pressure (ΔMAP) and the effect size of pulse wave velocity (PWV). The figure shows the association between ΔMAP and the effect size of pulse wave velocity analyzed by meta‐regression. MAP indicates mean arterial pressure.
Central Pulse Pressure
The between‐study residual variance was mostly explained by period of assessment (70%) and ΔMAP (76%) (Table 9). Due to the small number of studies, the association between ΔMAP and the effect size of central PP could not be evaluated.
Augmentation Index
The between‐study residual variance was mostly explained by the period of assessment (63%) and did not increase when ΔMAP was added to the same model (Table 9). No association between ΔMAP and the effect size of AIx was observed.
Discussion
In this systematic review we observed a significant decrease in arterial stiffness as measured by PWV and a reduction of wave reflection as measured by AIx in patients with end‐stage kidney disease after successful KTx. The decrease in PWV was observed globally as well as in each arterial territory (central, peripheral, and brachial‐ankle). Likewise, in subgroup analysis according to the period of assessment, the reduction in overall PWV was significant in all subgroups (≤3, 6, and 12 months post‐KTx). The reduction in PWV seems to translate into a lower central PP; however, the reduction in overall central PP was not significant. In subgroup analysis, central PP significantly decreased at ≤3 and 6 months post‐KTx but not at 12 months. PP is related to changes in the heart rate, and it is worth mentioning that in the study from Zoungas,9 the mean heart rate post‐KTx declined by 11 beats/min. This explains why the exclusion of the latter study in the sensitivity analysis resulted in a significant reduction in global analysis of central PP. AIx, which is a measure of wave reflection and was more frequently reported, declined significantly. The reduction in AIx was significant at ≤3 and at 12 months post‐KTx.
Sources of Heterogeneity
Statistical heterogeneity was present in the pooled data, coming from different sources. First, different vascular territories were used to assess PWV. Indeed, 7 studies8, 9, 20, 30, 31, 32, 33 looked at measures of aortic stiffness: the aorta is an elastic capacitive vessel and is more heavily affected with age and pathological conditions such as hypertension, CKD, and diabetes mellitus.4, 10, 39, 40, 41, 42 Three studies8, 9, 34 evaluated medium‐sized muscular vascular beds, which are physiologically stiffer and generally less affected by age and pathological conditions.4, 10, 39, 40, 41, 42 Finally, 4 studies35, 36, 37, 38 looked at brachial‐ankle PWV, which gives a general index of overall stiffness. Three studies20, 33, 35 performed measurement at different periods post‐KTx, and 2 studies8, 9 used multiple sites.
We first performed meta‐analyses regardless of the arterial territory and then by considering each arterial territory of PWV as an outcome using a random‐effect method. To deal with multiple measurements within a study, we considered in our global analysis the first measure after 1 week (first global analysis) or the latest measure until 1 year (second global analysis). In sensitivity analyses the statistical heterogeneity of the different effect sizes was considerably reduced in overall PWV and central PWV, from considerable to moderate and from substantial to moderate, respectively. But central PWV remained significantly decreased only in the latest period of assessment within a study. Likewise, central PP and AIx significantly decreased in sensitivity analyses, and the statistical heterogeneity of the effect sizes was considerably reduced.
Mean Arterial Pressure, Arterial Stiffness, and Period of Assessment
Vascular remodeling in CKD is complex, and it involves remodeling that is mediated not only through the effects of hypertension but also through mineral disorder–induced vascular calcification,40 endothelial dysfunction,43 and alterations of extracellular matrix by uremic toxins such as advanced glycation end products.44 A successful KTx improves fluid overload and improves the metabolic pathways that are potentially involved in CKD‐related vascular stiffness.7, 8 An improvement in arterial stiffness post‐KTx does suggest that arterial stiffness is potentially reversible. However, vascular stiffness is also affected by the operating MAP without any changes in the structure of vascular wall (ie, functional stiffness). In this systematic review only 2 studies reported a mean difference of PWV adjusted for MAP.8, 9 It is for this reason that we performed a meta‐regression to evaluate the association between changes in MAP (estimated by the Lian formula in 3 studies30, 33, 36) and the effect size of arterial stiffness parameters. A positive association between the effect size of arterial stiffness parameters and changes in MAP suggests that the improvement of arterial stiffness parameters may be related to either functional or structural improvement of vascular wall properties. Although this association was significant in univariate analysis, it was no longer significant after adjustment for the combined effect of the period of measurements and/or type of PWV. The association between changes in MAP and the effect size of central PP could not be evaluated due to a small number of studies, and we did not observe an association between changes in MAP and the effect size of AIx. In fact, the period of assessment seemed to explain the most important part of the residual variance in PWV, central PP, and AIx. These findings suggest that vascular wall remodeling post‐KTx may not follow a homogeneous pattern. Accordingly, it is possible that other factors, such as post‐KTx medication or activation of immune system (by HLA mismatching or infection), outweigh the initial improvement of uremia.
Risk of Bias
Risk of bias is a major concern for the internal validity of the results. Almost all studies were adjudicated to have a good (low risk of bias) or fair quality (moderate risk of bias). Indeed, the risk of selection bias was adjudicated as low in all except 2 studies, where it was adjudicated as high due to an important difference between the number of patients in baseline and after KTx.30, 34
Publication bias was likely for overall PWV, central PWV, brachial‐ankle PWV, and AIx. It was unlikely for peripheral PWV and central PP. Finally, the strength of evidence was classified as low for overall PWV, brachial‐ankle PWV, and AIx but very low for central PWV, peripheral PWV, and central PP.
Strengths and Limitations
The strengths of this review include the completeness of the search including hand searching of the gray literature and references of relevant citations, the statistical approach including random effect, and the confirmation of the findings in most of the subgroups, the strength of evidence classified as low for overall PWV, brachial‐ankle PWV, and AIx.
There are, however, some limitations in the interpretation of the results of this meta‐analysis. First, the use of various devices for the assessment of arterial stiffness parameters, kidney source (living or cadaveric), dialysis modality and duration before KTx, the timing of assessment (before and after transplantation), as well as immunosuppressive regimen could all constitute potential sources of heterogeneity. The impact of immunosuppressive drugs, considered as cointervention, could not be explored because little information was provided by the studies. Likewise, the impact of dialysis modality and duration before KTx could not be assessed. Blood pressure was not available for 1 study.34 Furthermore, the use of the Lian formula to calculate MAP also has its limits when applied to the average of a group's systolic and diastolic blood pressures. The number of included studies could not provide a statistical power necessary to detect all the differences, so some results of meta‐regression are at risk of type 2 error. Finally, we could not take into account, in the same model, many sources of heterogeneity in meta‐regression by using a random effect for each.
In summary, this study supports the conclusion that CKD‐related arterial stiffness may be reversible after a successful KTx. This is an important finding because it gives hope for a potential therapeutic intervention, targeting arterial stiffness in CKD. However, an individual data meta‐analysis may be required to perform additional analysis using a more sophisticated approach in determining the blood pressure–independent effect of a regression in arterial stiffness after KTx.45
Sources of Funding
Sidibé is supported by the Department of Medicine of Université Laval, the Fondation du CHU de Québec, and the Société Québécoise d'Hypertension Artérielle. Fortier holds a scholarship from the FRQ‐S (Fonds de Recherche du Québec‐Santé) and the Kidney Foundation of Canada. Desjardins holds a scholarship from the Société Québécoise d'Hypertension Artérielle through a contribution from SERVIER, Drs Mac‐Way and De Serres hold a KRESCENT (Kidney Research Scientist Core Education and National Training Program) scholarship supported by the CIHR (Canadian Institutes for Health Research), the Kidney Foundation of Canada, the Canadian Society of Nephrology, and from FRQ‐S. Dr Agharazii holds the Research Chair in Nephrology from Université Laval.
Disclosures
None.
Acknowledgments
We would like to thank Frederick Bergeron, librarian consultant at Université Laval, for his guidance in the conception of our research strategies. We are indebted to Hyunseon Kim and Woo Yang for their collaboration in providing us with the blood pressures of their original study through personal communication. We are grateful to Denis Talbot for his guidance in the statistical approach for the meta‐regression.
(J Am Heart Assoc. 2017;6:e007235 DOI: 10.1161/JAHA.117.007235.)29269351
References
- 1. Foley RN, Parfrey PS, Sarnak MJ. Epidemiology of cardiovascular disease in chronic renal disease. J Am Soc Nephrol. 1998;9:S16–S23. [PubMed] [Google Scholar]
- 2. Parfrey PS, Foley RN. The clinical epidemiology of cardiac disease in chronic renal failure. J Am Soc Nephrol. 1999;10:1606–1615. [DOI] [PubMed] [Google Scholar]
- 3. Go AS, Chertow GM, Fan D, McCulloch CE, Hsu CY. Chronic kidney disease and the risks of death, cardiovascular events, and hospitalization. N Engl J Med. 2004;351:1296–1305. [DOI] [PubMed] [Google Scholar]
- 4. Blacher J, Guerin AP, Pannier B, Marchais SJ, Safar ME, London GM. Impact of aortic stiffness on survival in end‐stage renal disease. Circulation. 1999;99:2434–2439. [DOI] [PubMed] [Google Scholar]
- 5. Shoji T, Emoto M, Shinohara K, Kakiya R, Tsujimoto Y, Kishimoto H, Ishimura E, Tabata T, Nishizawa Y. Diabetes mellitus, aortic stiffness, and cardiovascular mortality in end‐stage renal disease. J Am Soc Nephrol. 2001;12:2117–2124. [DOI] [PubMed] [Google Scholar]
- 6. Vlachopoulos C, Aznaouridis K, Stefanadis C. Prediction of cardiovascular events and all‐cause mortality with arterial stiffness: a systematic review and meta‐analysis. J Am Coll Cardiol. 2010;55:1318–1327. [DOI] [PubMed] [Google Scholar]
- 7. Foley RN, Parfrey PS, Sarnak MJ. Clinical epidemiology of cardiovascular disease in chronic renal disease. Am J Kidney Dis. 1998;32:S112–S119. [DOI] [PubMed] [Google Scholar]
- 8. Ignace S, Utescu MS, De Serres SA, Marquis K, Gaudreault‐Tremblay MM, Lariviere R, Cote I, Houde I, Lebel M, Agharazii M. Age‐related and blood pressure‐independent reduction in aortic stiffness after kidney transplantation. J Hypertens. 2011;29:130–136. [DOI] [PubMed] [Google Scholar]
- 9. Zoungas S, Kerr PG, Chadban S, Muske C, Ristevski S, Atkins RC, McNeil JJ, McGrath BP. Arterial function after successful renal transplantation. Kidney Int. 2004;65:1882–1889. [DOI] [PubMed] [Google Scholar]
- 10. Briet M, Boutouyrie P, Laurent S, London GM. Arterial stiffness and pulse pressure in CKD and ESRD. Kidney Int. 2012;82:388–400. [DOI] [PubMed] [Google Scholar]
- 11. Lacolley P, Challande P, Osborne‐Pellegrin M, Regnault V. Genetics and pathophysiology of arterial stiffness. Cardiovasc Res. 2009;81:637–648. [DOI] [PubMed] [Google Scholar]
- 12. Lakatta EG, Levy D. Arterial and cardiac aging: major shareholders in cardiovascular disease enterprises: part I: aging arteries: a “set up” for vascular disease. Circulation. 2003;107:139–146. [DOI] [PubMed] [Google Scholar]
- 13. Laurent S, Boutouyrie P, Lacolley P. Structural and genetic bases of arterial stiffness. Hypertension. 2005;45:1050–1055. [DOI] [PubMed] [Google Scholar]
- 14. Georgianos PI, Sarafidis PA, Liakopoulos V. Arterial stiffness: a novel risk factor for kidney injury progression? Am J Hypertens. 2015;28:958–965. [DOI] [PubMed] [Google Scholar]
- 15. Ibels LS, Alfrey AC, Huffer WE, Craswell PW, Anderson JT, Weil R III. Arterial calcification and pathology in uremic patients undergoing dialysis. Am J Med. 1979;66:790–796. [DOI] [PubMed] [Google Scholar]
- 16. Morris ST, McMurray JJ, Rodger RS, Jardine AG. Impaired endothelium‐dependent vasodilatation in uraemia. Nephrol Dial Transplant. 2000;15:1194–1200. [DOI] [PubMed] [Google Scholar]
- 17. Cai H, Harrison DG. Endothelial dysfunction in cardiovascular diseases: the role of oxidant stress. Circ Res. 2000;87:840–844. [DOI] [PubMed] [Google Scholar]
- 18. Modlinger PS, Wilcox CS, Aslam S. Nitric oxide, oxidative stress, and progression of chronic renal failure. Semin Nephrol. 2004;24:354–365. [DOI] [PubMed] [Google Scholar]
- 19. Taweesedt PT, Disthabanchong S. Mineral and bone disorder after kidney transplantation. World J Transplant. 2015;5:231–242. [DOI] [PMC free article] [PubMed] [Google Scholar]
- 20. Kaur M, Chandran D, Lal C, Bhowmik D, Jaryal AK, Deepak KK, Agarwal SK. Renal transplantation normalizes baroreflex sensitivity through improvement in central arterial stiffness. Nephrol Dial Transplant. 2013;28:2645–2655. [DOI] [PubMed] [Google Scholar]
- 21. Higgins JPT, Green S. Cochrane Handbook for Systematic Reviews of Interventions, version 5.1.0. London: The Cochrane Collaboration. 2011.
- 22. Moher D, Liberati A, Tetzlaff J, Altman DG; Group P . Preferred reporting items for systematic reviews and meta‐analyses: the PRISMA statement. Int J Surg. 2010;8:336–341. [DOI] [PubMed] [Google Scholar]
- 23. NIH NH, Lung and Blood Institute . Quality assessment tool for before‐after (pre‐post) studies with no control group. 2014;1. [Google Scholar]
- 24. Borenstein M, Hedges LV, Higgins JP, Rothstein HR. A basic introduction to fixed‐effect and random‐effects models for meta‐analysis. Res Synth Methods. 2010;1:97–111. [DOI] [PubMed] [Google Scholar]
- 25. Higgins JP, Thompson SG, Deeks JJ, Altman DG. Measuring inconsistency in meta‐analyses. BMJ. 2003;327:557–560. [DOI] [PMC free article] [PubMed] [Google Scholar]
- 26. Hayashino Y, Noguchi Y, Fukui T. Systematic evaluation and comparison of statistical tests for publication bias. J Epidemiol. 2005;15:235–243. [DOI] [PMC free article] [PubMed] [Google Scholar]
- 27. Gianna Rendina‐Gobioff JDK. Pub_bias: A sas® macro for detecting publication bias in meta‐analysis. 2006;PO04:1–17.
- 28. van Houwelingen HC, Arends LR, Stijnen T. Advanced methods in meta‐analysis: multivariate approach and meta‐regression. Stat Med. 2002;21:589–624. [DOI] [PubMed] [Google Scholar]
- 29. Guyatt GH, Oxman AD, Vist GE, Kunz R, Falck‐Ytter Y, Alonso‐Coello P, Schunemann HJ; GRADE Working Group . GRADE: an emerging consensus on rating quality of evidence and strength of recommendations. BMJ. 2008;336:924–926. [DOI] [PMC free article] [PubMed] [Google Scholar]
- 30. Keven K, Calayoglu R, Sengul S, Dincer I, Kutlay S, Erturk S, Erbay B, Nergizoglu G. Comparative effects of renal transplantation and maintenance dialysis on arterial stiffness and left ventricular mass index. Clin Transplant. 2008;22:360–365. [DOI] [PubMed] [Google Scholar]
- 31. Bachelet‐Rousseau C, Kearney‐Schwartz A, Frimat L, Fay R, Kessler M, Benetos A. Evolution of arterial stiffness after kidney transplantation. Nephrol Dial Transplant. 2011;26:3386–3391. [DOI] [PubMed] [Google Scholar]
- 32. Hornum M, Clausen P, Idorn T, Hansen JM, Mathiesen ER, Feldt‐Rasmussen B. Kidney transplantation improves arterial function measured by pulse wave analysis and endothelium‐independent dilatation in uraemic patients despite deterioration of glucose metabolism. Nephrol Dial Transplant. 2011;26:2370–2377. [DOI] [PubMed] [Google Scholar]
- 33. Kovacs D, Locsey L, Szabo L, Fedor R, Laczik R, Asztalos L, Soltesz P. Noninvasive perioperative monitoring of arterial function in patients with kidney transplantation. Transplant Proc. 2013;45:3682–3684. [DOI] [PubMed] [Google Scholar]
- 34. Covic A, Goldsmith DJ, Gusbeth‐Tatomir P, Buhaescu I, Covic M. Successful renal transplantation decreases aortic stiffness and increases vascular reactivity in dialysis patients. Transplantation. 2003;76:1573–1577. [DOI] [PubMed] [Google Scholar]
- 35. Ro H, Kim AJ, Chang JH, Jung JY, Chung WK, Park YH, Lee HH. Can kidney transplantation improve arterial stiffness in end‐stage renal patients? Transplant Proc. 2016;48:884–886. [DOI] [PubMed] [Google Scholar]
- 36. Hotta K, Harada H, Sasaki H, Iwami D, Fukuzawa N, Morita K, Seki T, Togashi M, Nonomura K. Successful kidney transplantation ameliorates arterial stiffness in end‐stage renal disease patients. Transpl Proc. 2012;44:684–686. [DOI] [PubMed] [Google Scholar]
- 37. Kim HS, Seung J, Lee JH, Chung BH, Yang CW. Clinical significance of pre‐transplant arterial stiffness and the impact of kidney transplantation on arterial stiffness. PLoS One. 2015;10:e0139138. [DOI] [PMC free article] [PubMed] [Google Scholar]
- 38. Nishioka T, Akiyama T, Nose K, Koike H. Arterial stiffness after successful renal transplantation. Transplant Proc. 2008;40:2405–2408. [DOI] [PubMed] [Google Scholar]
- 39. Avolio AP, Chen SG, Wang RP, Zhang CL, Li MF, O'Rourke MF. Effects of aging on changing arterial compliance and left ventricular load in a northern Chinese urban community. Circulation. 1983;68:50–58. [DOI] [PubMed] [Google Scholar]
- 40. Blacher J, Guerin AP, Pannier B, Marchais SJ, London GM. Arterial calcifications, arterial stiffness, and cardiovascular risk in end‐stage renal disease. Hypertension. 2001;38:938–942. [DOI] [PubMed] [Google Scholar]
- 41. McEniery CM, Yasmin, Hall IR, Qasem A, Wilkinson IB, Cockcroft JR; ACCT Investigators . Normal vascular aging: differential effects on wave reflection and aortic pulse wave velocity: the Anglo‐Cardiff Collaborative Trial (ACCT). J Am Coll Cardiol. 2005;46:1753–1760. [DOI] [PubMed] [Google Scholar]
- 42. Mitchell GF, Parise H, Benjamin EJ, Larson MG, Keyes MJ, Vita JA, Vasan RS, Levy D. Changes in arterial stiffness and wave reflection with advancing age in healthy men and women: the Framingham Heart Study. Hypertension. 2004;43:1239–1245. [DOI] [PubMed] [Google Scholar]
- 43. McEniery CM, Wallace S, Mackenzie IS, McDonnell B, Yasmin, Newby DE, Cockcroft JR, Wilkinson IB. Endothelial function is associated with pulse pressure, pulse wave velocity, and augmentation index in healthy humans. Hypertension. 2006;48:602–608. [DOI] [PubMed] [Google Scholar]
- 44. Wolffenbuttel BH, Boulanger CM, Crijns FR, Huijberts MS, Poitevin P, Swennen GN, Vasan S, Egan JJ, Ulrich P, Cerami A, Levy BI. Breakers of advanced glycation end products restore large artery properties in experimental diabetes. Proc Natl Acad Sci USA. 1998;95:4630–4634. [DOI] [PMC free article] [PubMed] [Google Scholar]
- 45. Spronck B, Avolio AP, Tan I, Butlin M, Reesink KD, Delhaas T. Arterial stiffness index beta and cardio‐ankle vascular index inherently depend on blood pressure but can be readily corrected. J Hypertens. 2017;35:98–104. [DOI] [PubMed] [Google Scholar]