
Figure 1.
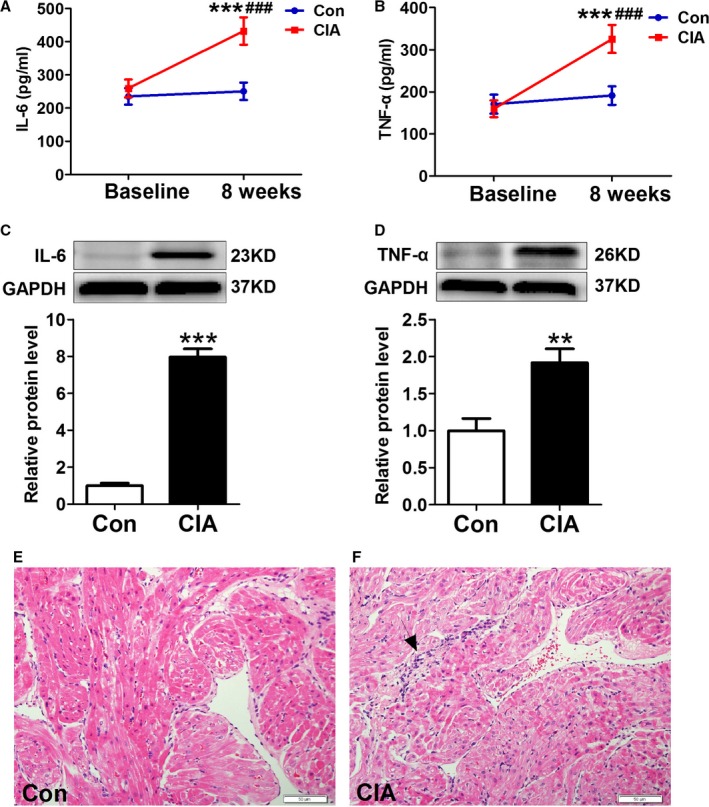
CIA‐induced systemic and atrial inflammation. A and B, Serum levels of IL‐6 (interleukin 6) and TNF‐α (tumor necrosis factor α) 8 weeks after primary collagen II and Freund's incomplete adjuvant injection (n=10 per group). C and D, Representative Western blots and quantification of IL‐6 and TNF‐α protein expression in atrial tissues (n=6 per group). E and F, Examples of hematoxylin and eosin staining (n=6 per group). **P<0.01, ***P<0.001, vs the CON group; ### P<0.001, vs baseline. Scale bar=50 μm. Arrow indicates the accumulation of inflammatory cells. CIA indicates collagen‐induced arthritis; CON, control.