
Figure 3.
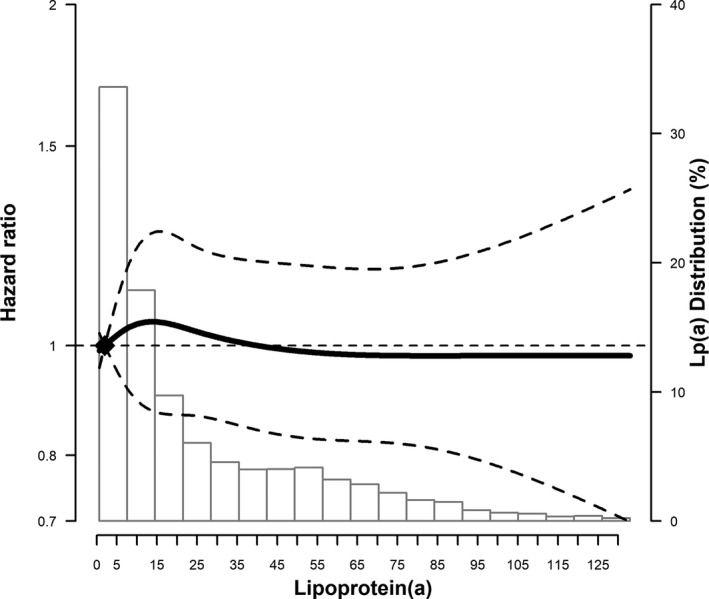
Atrial fibrillation (AF) risk across lipoprotein(a) (Lp[a]) levels. Multivariable‐adjusted restricted cubic spline model showing the hazard ratios of AF (95% confidence intervals) by Lp(a) levels at visit 4. The solid line represents hazard ratios and the dashed lines represent 95% confidence intervals. Knots at 5th, 35th, 65th, and 95th percentiles (corresponding to 1.3, 7.7, 23.9, and 83.1 mg/L). The spline is centered at the 10th percentile. The histogram shows the distribution of Lp(a) levels. Restricted cubic spline is truncated at the 1st and 99th percentiles of Lp(a). The model is adjusted for age, sex, race‐center groups, smoking, systolic and diastolic blood pressure, treatment for hypertension, heart rate, height, body mass index, ECG left ventricular hypertrophy, PR interval, prevalent heart failure, coronary artery disease, diabetes mellitus, low‐density lipoprotein cholesterol, high‐density lipoprotein cholesterol, triglycerides, lipid‐lowering medication, and log‐transformed N‐terminal pro–B type natriuretic peptide.