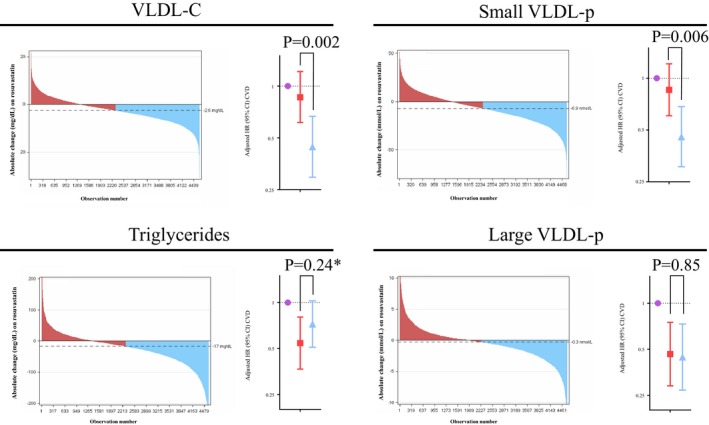
Figure 3.

Waterfall plot demonstrating the range of individuals’ absolute changes in VLDL‐C, small and large VLDL‐p, and triglycerides with rosuvastatin 20 mg daily. Subjects were divided into Minimal Response (red) and Larger Response (blue) groups based on whether they had greater than or less than the median reduction in the given marker. Cox models (comparing risk with those in the current substudy allocated to placebo as the reference population) are adjusted for age, sex, race, smoking, body mass index, systolic blood pressure, fasting glucose, baseline HDL‐C, baseline hsCRP, baseline VLDL‐related marker level, and change in LDL‐C. Among those on rosuvastatin, the median (IQR) on‐treatment LDL‐C levels in the Minimal Response and Larger Response groups were 57 (45, 78) and 52 (42.0, 66.0) mg/dL, respectively, in the small VLDL‐p change group and 58 (45, 82) and 51 (45, 65) mg/dL, respectively, in the VLDL‐C change group. *Between‐response group comparison among participants in this stubstudy (N=9423) P=0.24 and among all JUPITER participants with triglyceride measure (N=15 546) P=0.28.
