
Figure 4.
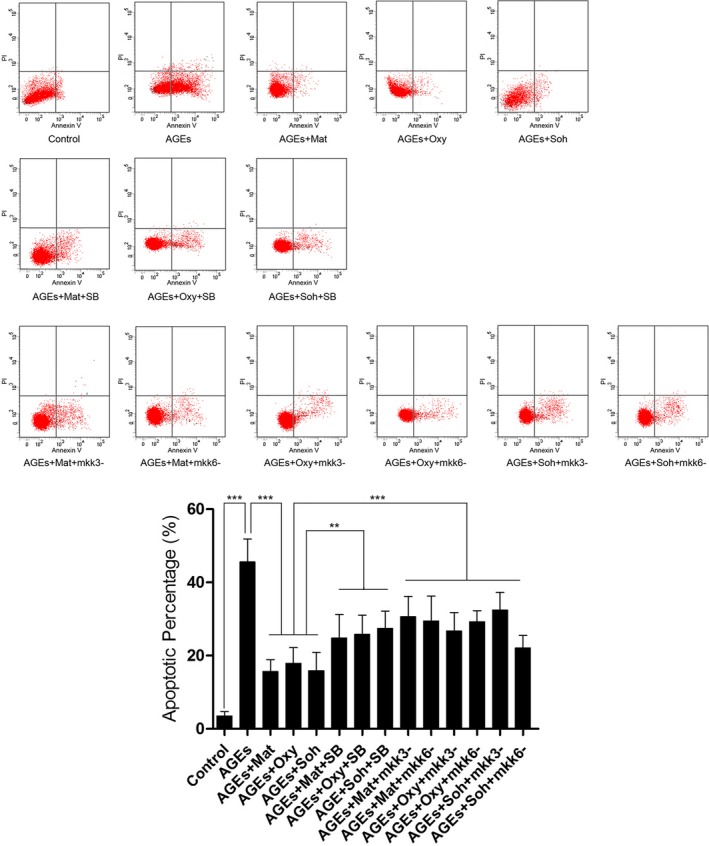
Charts on the upper panel of this figure demonstrate PI/Annexin V double staining detected by a flow cytometer. Columns on the lower panel indicate the apoptotic percentage in Control, AGEs, AGEs+Mat, AGEs+Oxy, AGEs+Soh, AGEs+Mat+SB, AGEs+Oxy+SB, AGEs+Soh+SB, AGEs+Mat+mkk3−, AGEs+Mat+mkk6−, AGEs+Oxy+mkk3−, AGEs+Oxy+mkk6−, AGEs+Soh+mkk3−, and AGEs+Soh+mkk6−, respectively (3 independent experiments were performed; **P<0.01; ***P<0.001).