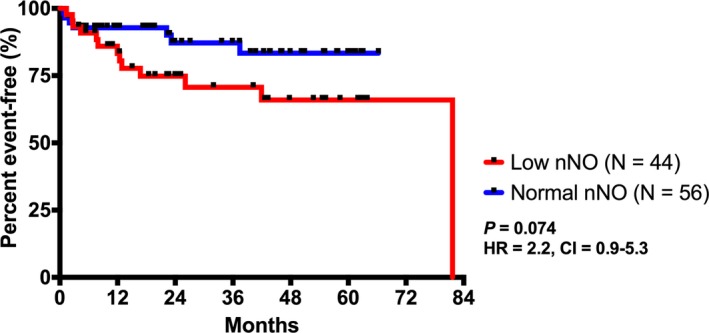
Figure 4.

Kaplan‐Meier plot showing time from nasal NO (nNO) measurement to either heart transplant or death. There was a lower proportion of event‐free patients in the low nNO group within the 7‐year study period, although this did not reach statistical significance. CI indicates confidence interval; and HR, hazard ratio.
