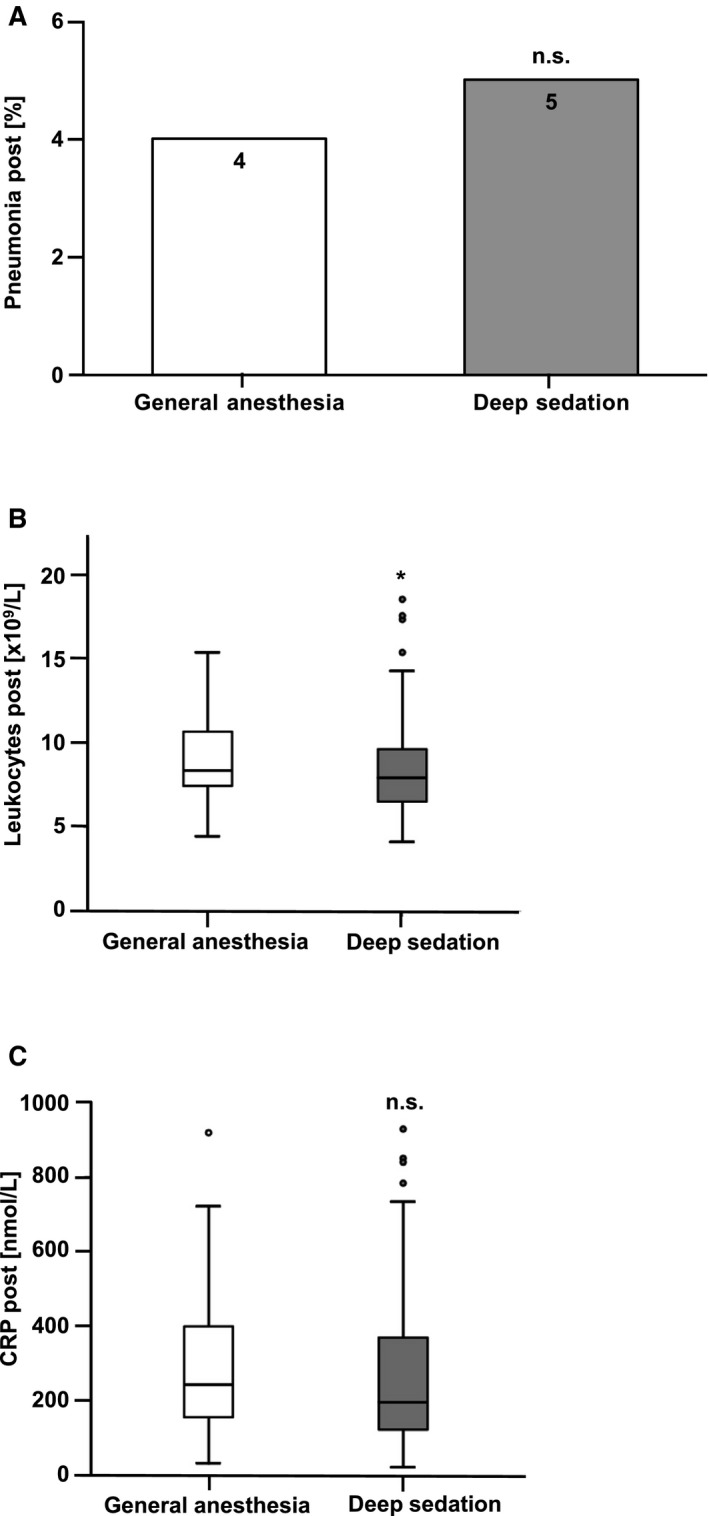
Figure 4.

Comparison of pneumonia and inflammatory markers in the general anesthesia (GA) vs deep sedation (DS) groups. Bar diagram showing the percentage of patients per group with an event. A, The incidence of postprocedural pneumonia in patients undergoing percutaneous mitral valve repair (PMVR) using GA vs DS showed no significant differences between both groups. No significant (n.s.) difference between the groups was observed, P=0.77. B, Boxplot diagrams showing values in the DS and GA groups. The boxes consist of the 25% to the 75% quartiles of all measurements. The crossline marks the median of measurements (50% quartile). The whiskers mark the smallest and largest measurements. The circles are outliers. The blood leukocyte count was significantly lower after the PMVR procedure in the DS compared with the GA group, *P=0.018. C, Postprocedural C‐reactive protein (CRP) values were similar in the GA and the DS groups. No significant difference was observed between groups, P=0.1.
