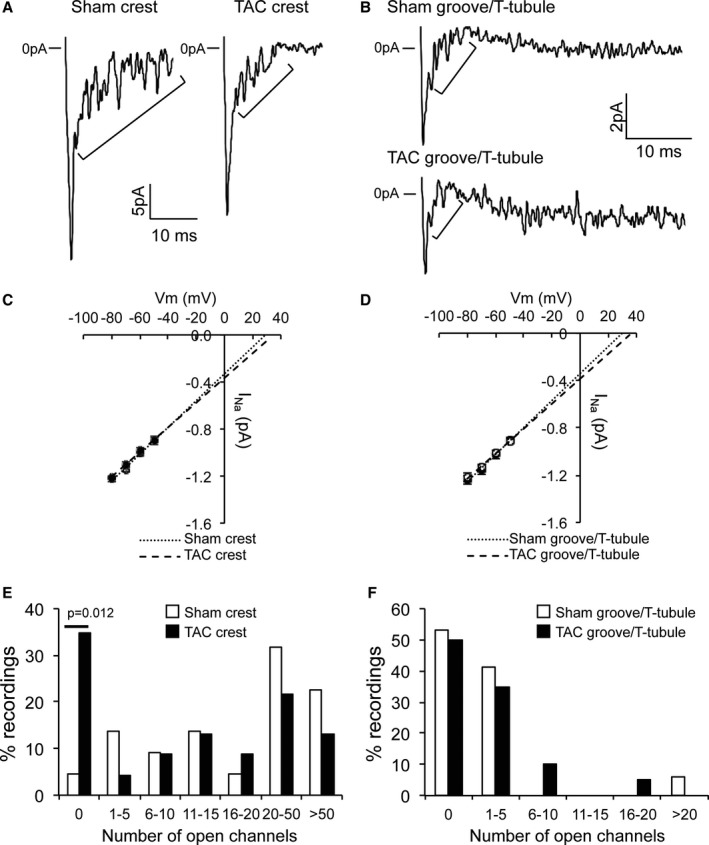
Figure 5.

Decreased sodium current (INa) at the crest of transverse aortic constriction (TAC) cardiomyocytes. A, Typical INa recordings at the crest of sham–operated on (Sham) and TAC lateral membrane. Brackets highlight single‐channel events. B, Typical INa recordings in the groove/T tubule of Sham and TAC lateral membrane. Brackets highlight single‐channel events. Please note the scale. C, Identical unitary channel conductance in crest in Sham and TAC. Numbers of events at −50, −60, −70, and −80 mV are for Sham 68, 138, 139, and 85, respectively, and for TAC 29, 58, 87, and 114, respectively. D, Identical unitary channel conductance in groove/T tubule in Sham and TAC. Numbers of events at −50, −60, −70, and −80 mV are for Sham 73, 76, 62, and 72, respectively, and for TAC 66, 67, 58, and 66, respectively. E, Decreased numbers of channels at the crest of TAC cardiomyocytes when compared with TAC (χ2 test, P=0.012 for “0”). F, Identical number of open channels in groove/T tubule in Sham and TAC cardiomyocytes.
