Figure 4.

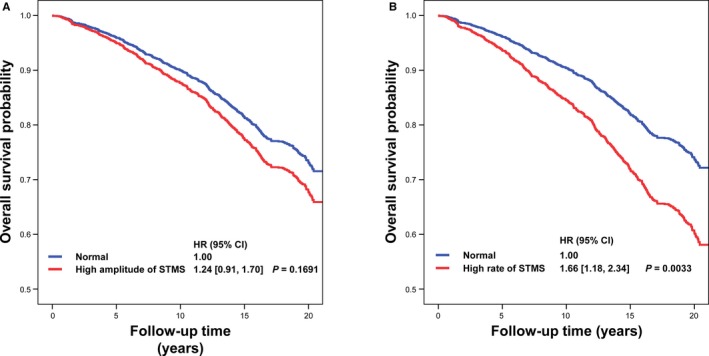
Survival curves of subjects stratified according to high or normal amplitude of sleep‐trough morning blood pressure surge (STMS; A) and high or normal rate of STMS (B). CI indicates confidence interval; and HR, hazard ratio.

Survival curves of subjects stratified according to high or normal amplitude of sleep‐trough morning blood pressure surge (STMS; A) and high or normal rate of STMS (B). CI indicates confidence interval; and HR, hazard ratio.