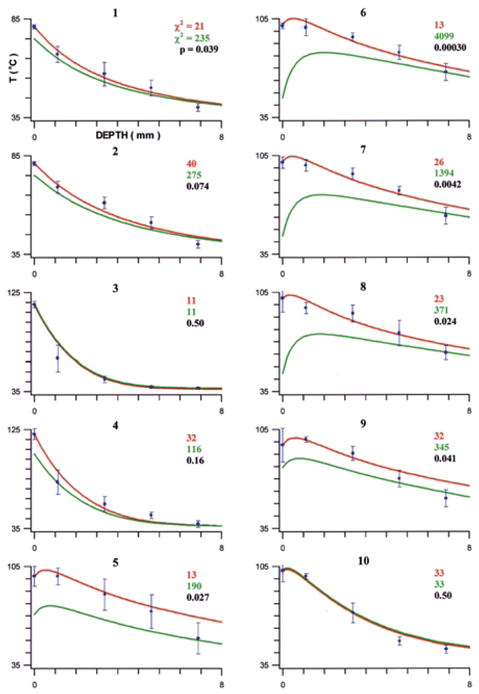
Fig. 4.

Finite element simulation results, separated by experimental group (labeled on top of each graph): FEM 2 (assuming T0 predicts intramyocardial temperatures) in red; FEM 1 (assuming TE predicts intramyocardial temperatures) in green. The data points (mean temperature) with error bars (standard deviation) represent in vitro data. The chi-square value, quantifying the agreement between FEM and in vitro data, is shown in the corresponding color. A variance ratio test was performed between the chi-square values of FEM 1 and FEM 2; the resulting P value indicates whether FEM 2 agreed with the in vitro data significantly better than FEM 1.
