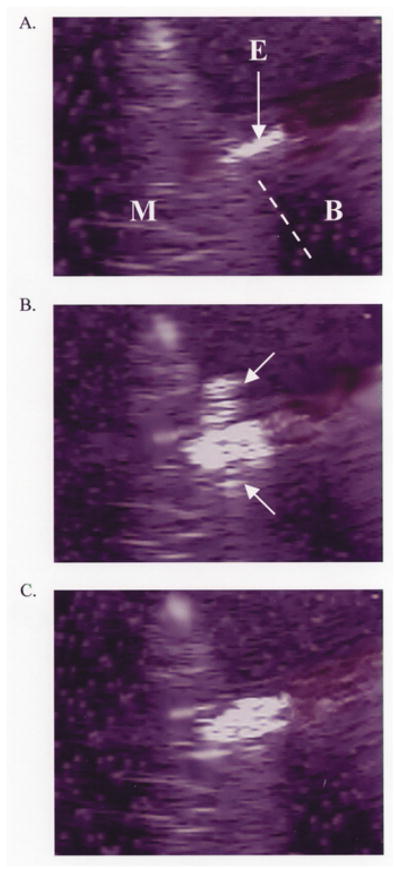
Fig. 6.
A. Echocardiographic image prior to initiation of RF application demonstrating myocardium (M), superfusing blood (B), and ablation electrode (E). The dotted line demarcates a portion of the electrode–endocardial interface. Scale is 1 centimeter. B. Echocardiographic image during RF application, at the moment of interfacial bubbling. The interfacial bubbles are difficult to appreciate in a static image, except that they are echodense. A “plume” of bubbles (arrows) can be seen escaping to either side of the electrode–endocardial interface. Scale is 1 centimeter. C. Echocardiographic image after RF application, after resolution of all bubbling. A significant widening of the electrode was observed. Scale is 1 centimeter.

