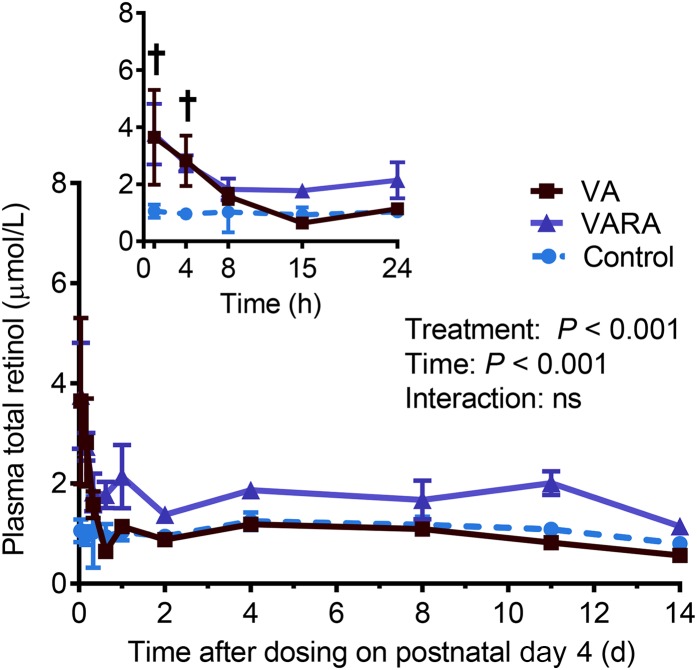
FIGURE 2.
Plasma total (unesterified + esterified) retinol concentrations in control and VA- and VARA-supplemented neonatal rat pups from 0 to 14 d after dosing on postnatal day 4. The inset shows the first 24 h after dosing. Each point represents the mean ± SEM of n = 7 (control), n = 4 (VA), or n = 3 (VARA) rat pups. †Supplemented groups compared with control, P < 0.05 (ANOVA). VA, vitamin A; VARA, VA combined with retinoic acid.

