. 2017 Aug 15;6:e27069. doi: 10.7554/eLife.27069

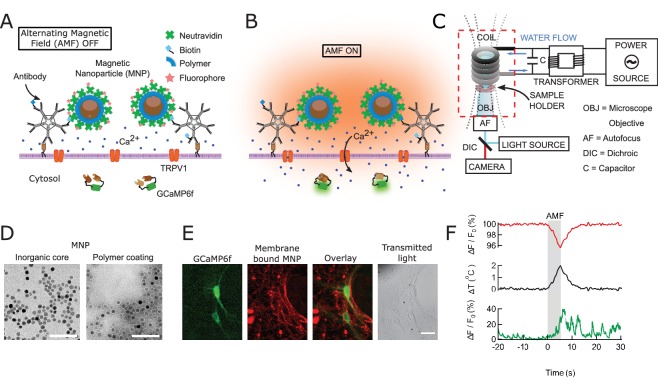
Figure 1. Magnetothermal genetic neurostimulation activates TPRV1 channels by heating membrane-bound magnetic nanoparticles using an alternating magnetic field.

(A) Magnetic nanoparticles (MNPs) (brown), encapsulated in PMA polymer (blue ring) are functionalized with NeutrAvidin (green), conjugated with Dylight550 fluorophores (red stars), and attached to the neuronal membrane via biotinylated antibodies targeting membrane proteins. The neurons are transfected to express temperature-sensitive TRVP1 channels and the calcium indicator GCaMP6f. (B) Applying an alternating magnetic field (‘AMF on’) heats the membrane-bound MNPs. This heat dissipates, raising the temperature locally near the membrane, which activates the TRPV1 channels. The resulting calcium influx depolarizes the neurons and is measured as a transient intensity increase of the GCaMP6f fluorescence. (C) The experimental setup combining the alternating magnetic field (AMF) application with fluorescence microscopy for in-vitro studies. The AMF (dotted lines) is produced by a five turn, continuously water cooled coil made of copper pipe. The coil and capacitor C form an electrical resonator that is driven by a 7.5 kW alternating power source. Neurons grown on cover glass are placed directly underneath the coil in a non-metallic sample holder. The AMF causes eddy currents in metal parts, including the microscope objective (OBJ). Any focus drifts are compensated by a fast laser autofocus (AF) (also see Figure 1—figure supplement 4). Components within the red, dashed box are to scale. (D) Transmission electron micrographs showing 12.5 ± 1.2 nm core-shell MNPs. (Left) MNPs as synthesized. (Right) Negative staining visualizes the PMA polymer shell encapsulating the dark inorganic nanoparticles. Scale bar is 100 nm long. (E) From left to right: fluorescence micrographs of GCaMP6f+ (green) neuron; labeled with MNPs (red); overlay of the GCaMP6f (green) and MNP (red) signals; and transmitted light image of the same neurons. Scale bar 10 µm (See also Figure 1—figure supplement 2A). (F) (Top) Local heating of MNPs during AMF application measured as a dip in DyLight 550 fluorescence intensity (red trace), which drops linearly with increasing temperature. The grey bar indicates the application of the AMF (22.4 kA/m, 412.5 kHz). (Middle) Temperature change near MNPs, as calculated from the fluorescence data using the calibration shown in Figure 1—figure supplement 3 (black trace). (Bottom) The GCaMP6f fluorescence signal recorded in the neuron decorated with nanoparticles shows a Calcium transient after 5 s of AMF when the membrane temperature increased by 2°C. Temperature decreased after the AMF was removed and the Calcium transients slowly subsided again.

Figure 1.

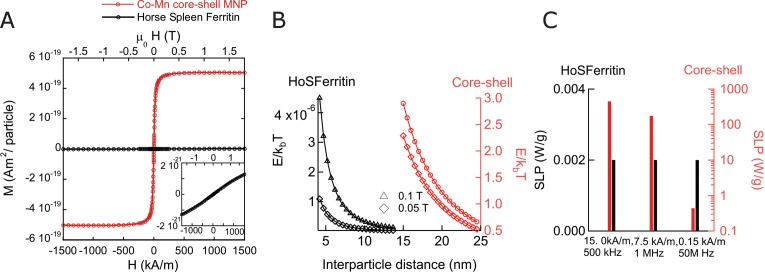
Figure 1—figure supplement 1. Magnetic properties of nanoparticles and ferritin.

Figure 1—figure supplement 1.

(A) Magnetization as function of external field at 37°C per particle, comparing horse spleen ferritin (Data credit in Supplemental methods section) to the exchange coupled core-shell MNPs used in our work. The magnetization per particle for ferritin is considerably smaller than that of the synthesized particles. (B) Magnetic dipole-dipole interaction energy as function of center-center separation between two MNP, comparing horse spleen ferritin (HoSF) particles to core-shell (Cobalt Ferrite/Manganese Ferrite) particles. Magnetization per particle was calculated using the indicated magnetic field strengths at 37°C. The lower bound of x axis for each particle type coincides with the minimum distance of separation, when neighboring particles physically touch each other. As is evident, the interaction energy between ferritin particles are 6–7 orders lower than the thermal energy. (C) Comparison of SLPs of core-shell MNPs and horse spleen ferritin particles at various frequencies. The magnetic field strength chosen are obtained from the limiting cases of biomedical applications, at these frequencies. 5 log units lower SLP values are seen at frequencies under 1 MHz.
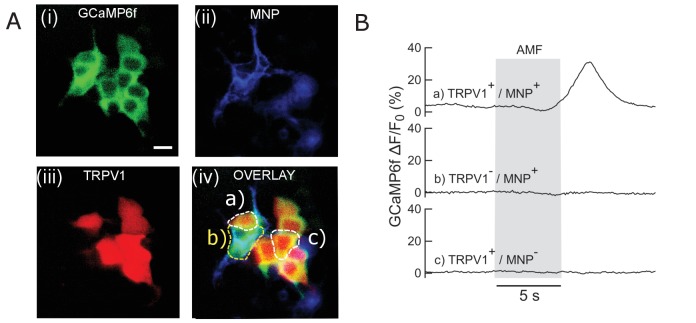
Figure 1—figure supplement 2. Control experiments in HEK293T cells.

Figure 1—figure supplement 2.

(A) Faux color micrograph showing a group of HEK293T cells showing in the same dish various control and experimental conditions. Cells co-transfected with (i) GCaMP6f only; (ii) GCaMP6f + AP CFP-TM; (iii) GCaMP6f + TRPV1; (iv) GCaMP6f + TRPV1+AP CFP-TM were cultured in the same dish. The field of view contains cells with all four transfection conditions. MNPs only bound to the membrane (via biotinylated antibodies) of the AP-CFP-TM cells (conditions, ii and iv). Thus, we could obtain all the conditions, e.g. (a) TRPV1+ /MNP+; (b) TRPV1- /MNP+; (c) TRPV1+/MNP- in the same field of view. Representative cells are marked in the micrograph. Top left shows the fluorescence micrographs taken through the GFP channel. All cells expressing GCaMP6f are visible here. Top right shows TRPV1 expression via the fluorescence of DsRed markers, in the same field of view. MNP fluorescence is shown through Alexa 647 channel (bottom left). Overlay of all three channels is shown in bottom right. (B) GCaMP6f signal change recorded from the culture (snapped in B). Only a) TRPV1+/MNP+ cells show Calcium influx with AMF application (grey bar; 22.4 kA/m, 412.5 kHz). Conditions b) TRPV1- /MNP+; (c) TRPV1+/MNP- showed no change in baseline GCaMP6f fluorescence intensity. This shows that TRPV1+/MNP+ is the necessary and sufficient condition to evoke calcium influx with AMF.
Figure 1—figure supplement 3. Calibration for in-situ temperature measurements.
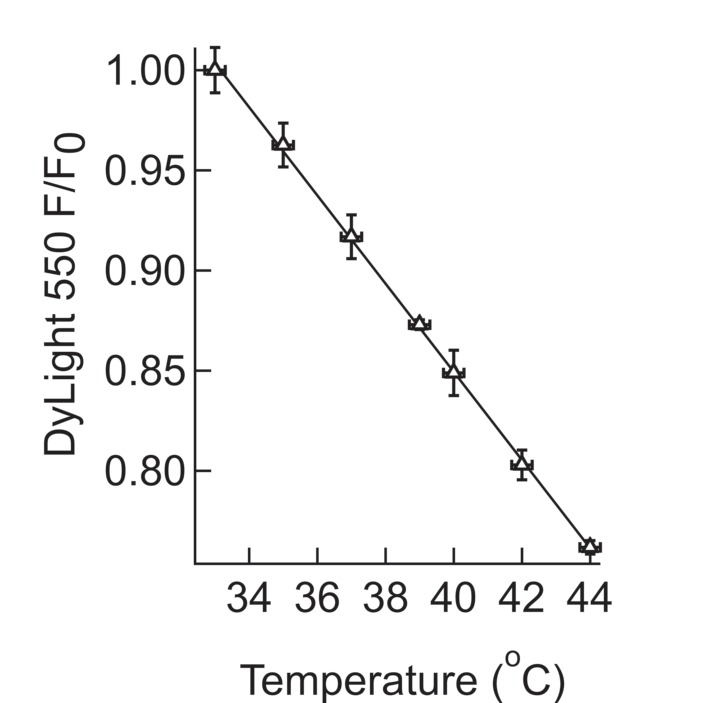
Figure 1—figure supplement 3.

Calibration of the temperature dependence of the fluorescence intensity of DyLight 550. A suspension of MNPs coated with NeutrAvidin - DyLight 550 was slowly heated to 44°C, while recording the fluorescence intensity. At each temperature point, multiple measurements were taken, which were then averaged and the s.e.m calculated.
Figure 1—figure supplement 4. Imaging set-up compatible with AMF heating.
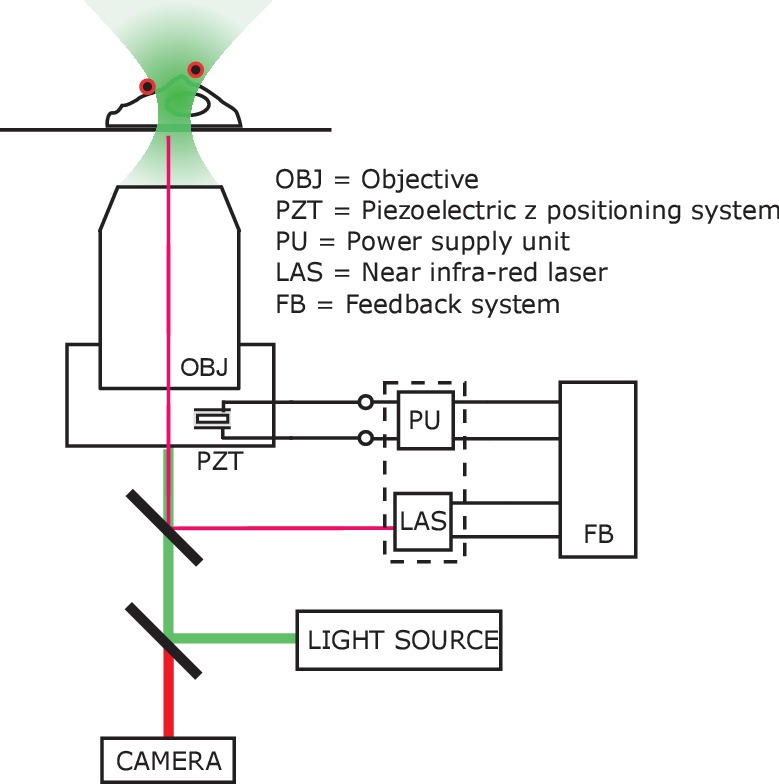
Figure 1—figure supplement 4.

Schematic of the autofocus setup, compensating any optical aberrations and z-shift caused by eddy current heating of the objective lens. The microscope objective (OBJ) was mounted on an adapter, controlled by piezo-electric z positioning system (PZT). The piezo-electric crystal was powered (−30V – 130V) by a supply unit (PU) which was controlled by the feedback system (FB). The feedback system adjusted the piezo power in accordance with the transduced signal from the laser unit (LAS), which monitored the relative position of the glass coverslip with respect to the objective lens. Faux color micrograph showing a group of HEK293T cells showing in the same dish various control and experimental conditions. Cells co-transfected with (i) GCaMP6f only; (ii) GCaMP6f + AP CFP-TM; (iii) GCaMP6f + TRPV1; (iv) GCaMP6f + TRPV1+AP CFP-TM were cultured in the same dish. The field of view contains cells with all four transfection conditions. MNPs only bound to the membrane (via biotinylated antibodies) of the AP-CFP-TM cells (conditions, ii and iv). Thus, we could obtain all the conditions, e.g. (a) TRPV1+ /MNP+; (b) TRPV1- /MNP+; (c) TRPV1+/MNP- in the same field of view. Representative cells are marked in the micrograph. Top left shows the fluorescence micrographs taken through the GFP channel. All cells expressing GCaMP6f are visible here. Top right shows TRPV1 expression via the fluorescence of DsRed markers, in the same field of view. MNP fluorescence is shown through Alexa 647 channel (bottom left). Overlay of all three channels is shown in bottom right.