. 2017 Aug 15;6:e27069. doi: 10.7554/eLife.27069

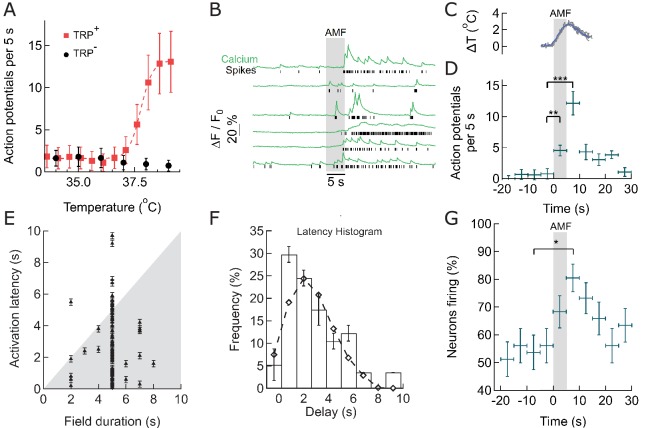
Figure 3. Within seconds of AMF application, membrane-targeted MNP stimulate magnetothermally TPRV1+ neurons in culture.

(A) Rate of Action Potential firing as a function of bath temperature, recorded from GCaMP6f transients observed in TRPV1 expressing hippocampal neurons (red) and wild-type neurons (control, black) when perfused with pre-heated buffer. The Ca2+ transients are modeled by a spike train (see Figure 3—figure supplement 1). The data points are fitted with Hill equation, giving a midpoint of 37.7 ± 0.06°C, which corresponds to half maximal firing rate (dashed curve). (B) GCaMP6f fluorescence intensity changes (green, Ca2+) in different TPRV1 +neurons decorated with MNP (5 s field, 22.4 kA/m at 412.5 kHz, in gray). Calculated spike events (black) are indicated under each Ca2+ trace (see Figure 3—figure supplement 2). (C) Change of cell surface temperature as measured by DyLight550 fluorescence (average of three experiments). (D) GCaMP6f signal recorded from nanoparticle-coated TRPV1 +neurons binned in 5 s intervals, indicated by x error bar (mean ±s.e.m, 13 neurons). The spiking frequency increased from 1.8 ± 0.6 per 5 s, before AMF (field 0 to 5 s), to 4.5 ± 1.2 per 5 s, during the AMF (n = 13, **p=0.0028, unpaired T-test), and 12.1 ± 2.0 per 5 s immediately following the AMF (n = 13, ***p=0.0002, unpaired T-test, 95% confidence intervals [1.5,2.23] and [10.8,13.3]) (Supplement 2). (E) Plot of activation latency, time interval between onset of field stimulation and first AP detect versus field duration. All data points lying on the gray background indicate that the first spike was detected while the field was still on (87% of events, n = 79, six cultures). Error bars indicate the temporal measurement uncertainty. (F) Percentage of neurons firing their first AP after field onset in the time interval indicated (subset of 41 cells from A which were stimulated for 5 s). The histogram was fitted (no weighting) with a Poisson curve (λ = 2.18 ± 0.17 s). Error bars are obtained as difference in population between bins shifted to left and right, following temporal uncertainty as indicated in (E). (G) Percentage of active neurons in each time interval (Alternating magnetic field applied 0–5 s). Error bars: x indicate 5 s time bin, y as in (F). A five-second AMF application increased the active population from 53.7 ±1.6% to 80.5 ±5.1% of neurons, *p=0.032, unpaired T-test, (n = 41, same as in (F)).

Figure 3.

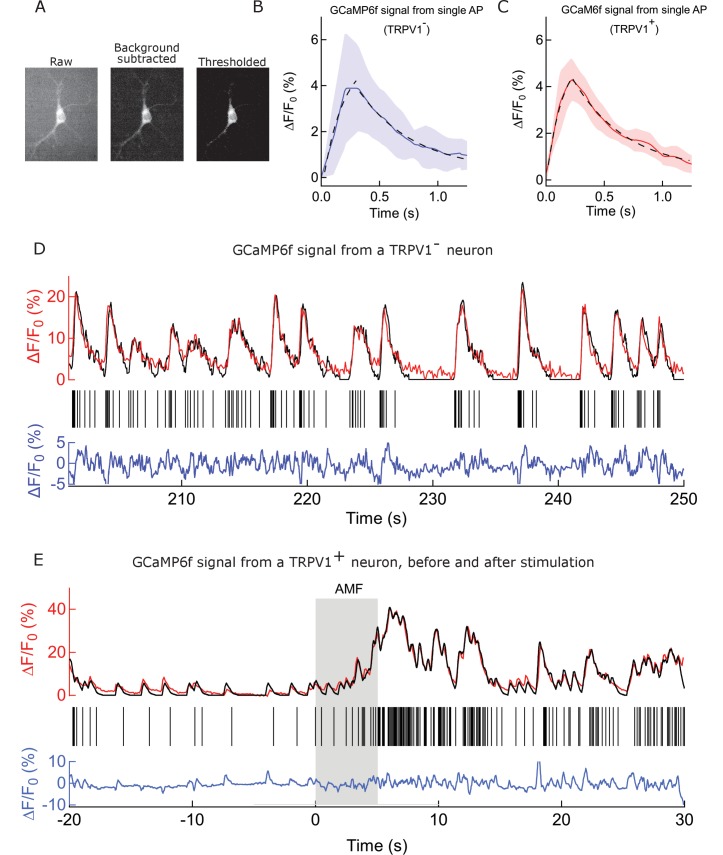
Figure 3—figure supplement 1. Procedure and controls to deduce spike train from GCaMP signal.

Figure 3—figure supplement 1.

(A) Fluorescence micrographs of a GCaMP6f expressing neuron. (Left to right) raw image, as recorded; background subtracted with 50 pixel rolling ball on the same ROI; image after turning grey values of all pixels under a particular threshold intensity value to Not a Number (NaN). This operation removes noise and extracts pixels corresponding to soma for each frame of a video. (B) Mean and SEM of Calcium peaks corresponding to single action potential events (see Supplemental methods), recorded from 5 somas of WT rat hippocampal neurons expressing GCaMP6f. Data from each soma is the mean of 3 smallest calcium transients (kernel function). The average rise time is 232.2 ms and the t1/2 of decay is 335.5 ms. The peaks resulted from spontaneous firing and were recorded over a temperature range of 32–40°C. Black dashed curve shows exponential fits corresponding to the rise and fall phases. (C) Mean and sem of Calcium peaks corresponding to single action potential events, recorded from 6 somas of rat hippocampal neurons expressing GCaMP6f and TRPV1 channels. Data from each soma is the mean of 3 smallest calcium transients (kernel function) (recored over 32–39°C). The average rise time is 220.0 ms and the t1/2 of decay is 320.2 ms, showing no significant deviation from the peaks resulting from spontaneous firing. Black dashed curve shows exponential fits corresponding to the rise and fall phases. (D) Analysis of time course GCaMP6f fluorescence intensity change from the soma of a WT rat hippocampal neuron. (Top) Time course recording of GCaMP6f signal from the same soma (red) after exponential bleach correction. Overlaid in black is the reconstructed signal obtained by convolving the kernel function with binary action potential events. (Middle) Calculated action potentials (black sticks). (Bottom) Residual between the reconstructed waveform and the normalized signal is shown in blue. The scale indicates percentage change with respect to the signal baseline. (E) Analysis of time course GCaMP6f fluorescence intensity change from the soma of a rat hippocampal neuron expressing TRPV1 channels and decorated with nanoparticles on the membrane. (Top) Time course recording of GCaMP6f signal from the same soma (red) after exponential bleach correction. Overlaid in black is the reconstructed signal obtained by convolving the kernel function with binary action potential events. An increased firing rate is observed during AMF application (Grey bar) (Middle) Calculated action potentials (black sticks). (Bottom) Residual between the reconstructed waveform and the normalized signal is shown in blue. The scale indicates percentage change with respect to the signal baselin.
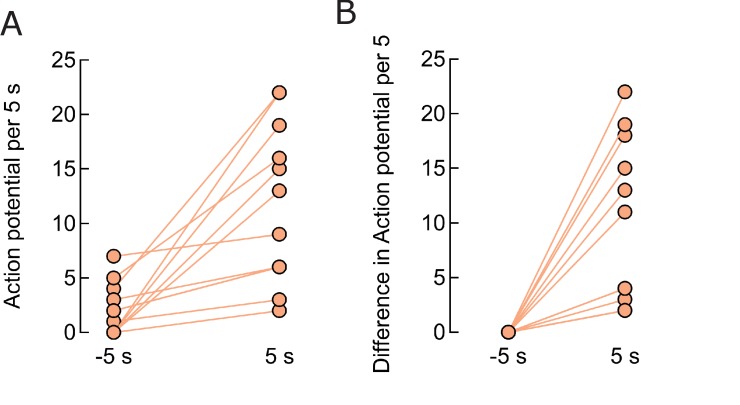
Figure 3—figure supplement 2. Firing rate enhancement in individual neurons.

Figure 3—figure supplement 2.

(A) Comparison of firing 5 s before, 1.8±0.6 APs, and after the field start, 12.1±2.0 APs (p=0.0002, n = 13). (B) Difference in the firing rate during the 5 s period before and the same period after field application, average 10.2±2.1 APs (p=0.0004, n = 13).