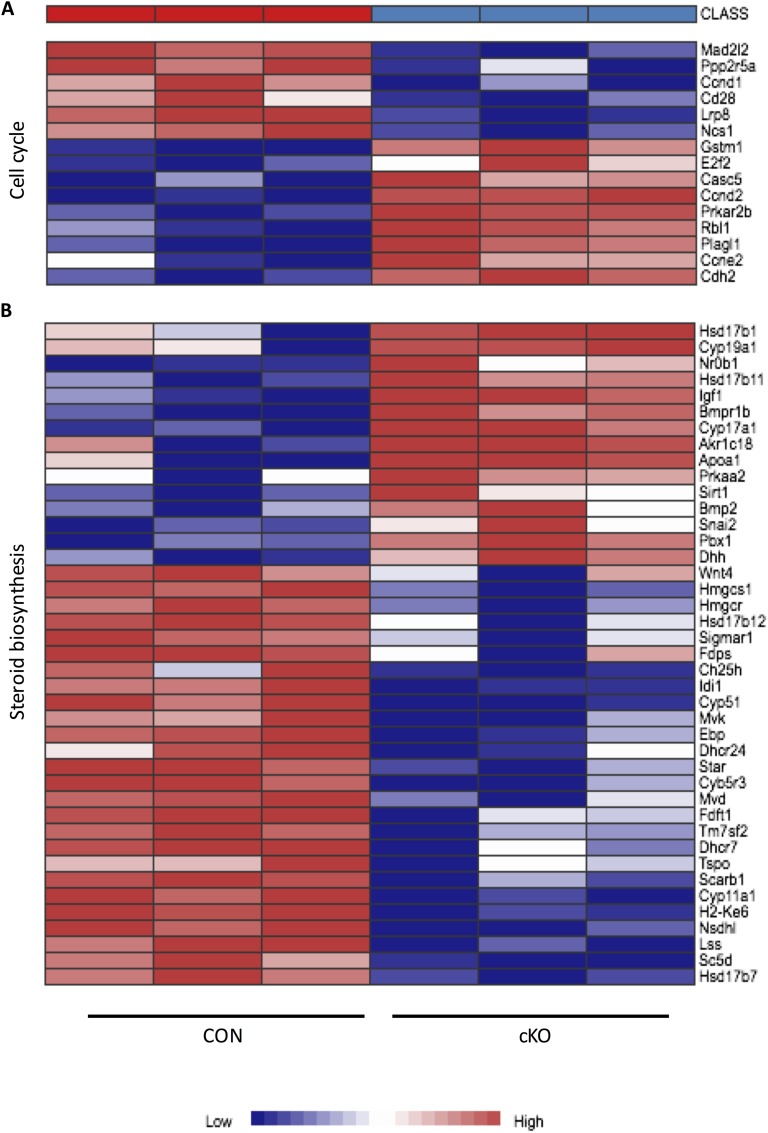
Figure 3.
Heat map derived from gene ontology analysis of microarray data from CON and cKO mice following gonadotropin stimulation in vivo. Represented are two of the top nine enriched pathways for (A) cell-cycle and (B) steroidogenesis-related genes, demonstrating twofold or greater variation in expression in granulosa cells. As noted in the color bar, genes in the cKO column are underexpressed relative to CON values, whereas genes in red are overexpressed. Probability cutoff was P < 0.05.

