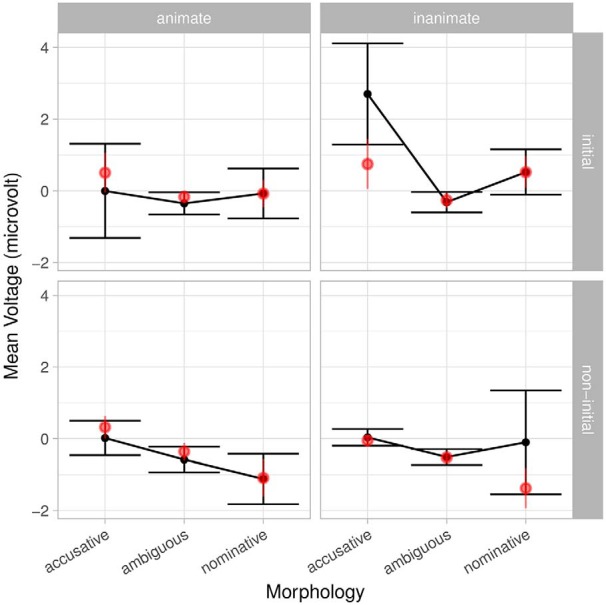
Figure 8.

Interaction of animacy, morphology and position from the full sentence-feature model with index and frequency class. Bars indicate 95% confidence intervals. Light red points are grand averages by participants over all trials; the corresponding lines are standard error of the (grand) mean. Interactions with position show themselves as differences between the top and bottom rows, while interactions with animacy show themselves as differences between columns.
