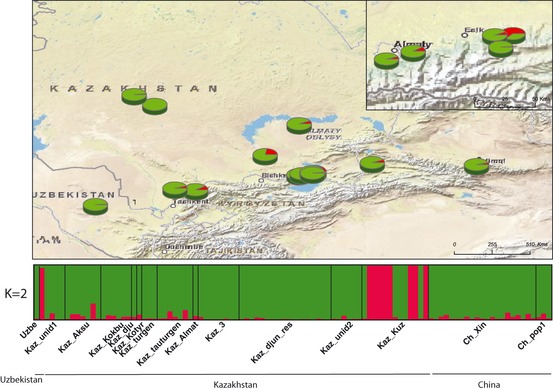
Figure 3.

Bayesian clustering results for Malus sieversii (N = 101) in Central Asia, obtained with TESS at K = 2, and associated map of mean membership probabilities per site. Each individual is represented by a vertical bar, partitioned into K segments representing the amount of ancestry of its genome corresponding to K clusters. Visualization was improved by sorting genotypes by site.
