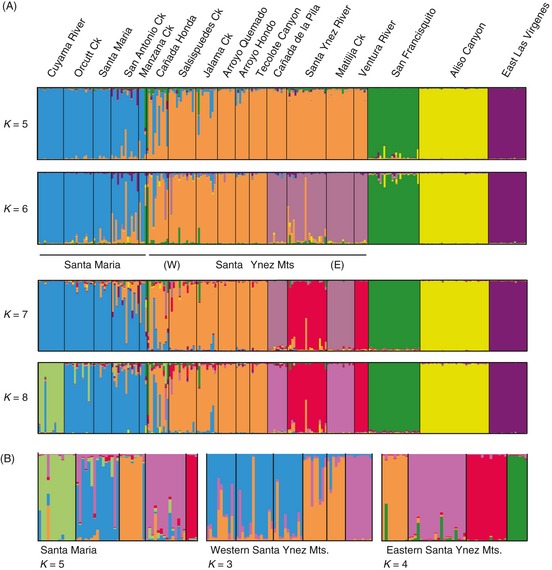
Figure 2.

(A) Plots of the assignment coefficients estimated in structure (KMAX = 5–8). Populations are arranged in geographic order from the west/northwest part of the sampling range to east/southeast (left to right, respectively). (B) Nested structure analyses based on clusters with multiple‐site membership identified at KMAX = 6 (delimited by solid bars).
