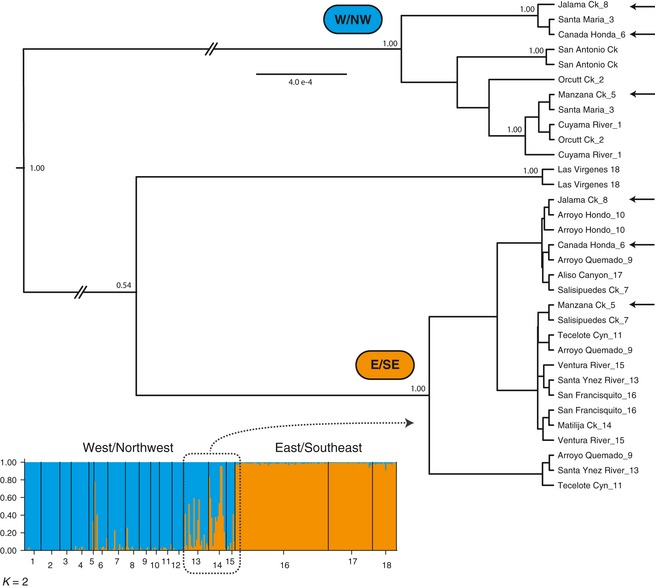
Figure 3.

Assignment plot for K = 2 and a maximum clade credibility tree based on mtDNA sequence data. Box overlaying the assignment plot shows that populations with admixed microsatellites alleles are all members of the east/southeast phylogroup. Arrows at the tree tips depict sites with mixed‐clade mtDNA haplotypes. Numbers above the branches are posterior probabilities.
