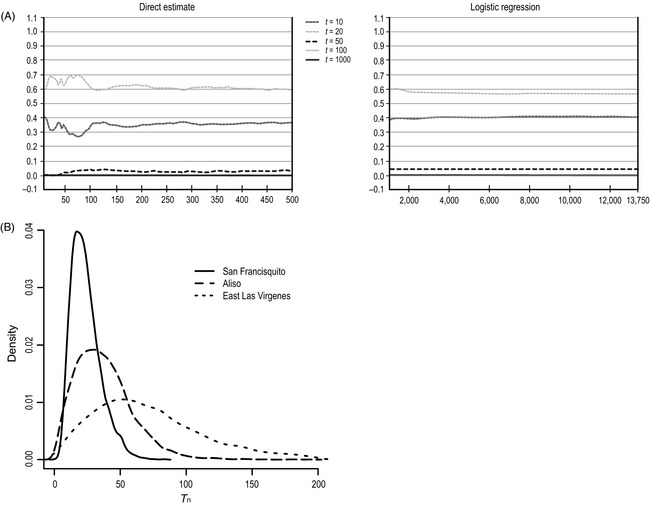
Figure 4.

(A) Posterior probabilities (y‐axis) for the five scenarios using the direct and logistic approaches as reported from DIY‐ABC for San Francisquito Canyon. The x‐axis corresponds to the different n δ closest data sets used in analyses. (B) Posterior estimates for the T parameter (generations before present) for the three range‐boundary populations. The value of T is the point in time where N e_historical > N e_pre‐fire contemporary; thus, population declines would have occurred at some time after the estimated T n.
