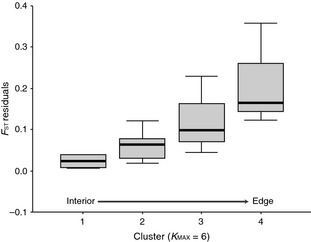
Figure 5.

Comparison of residuals from the regression of pairwise FST values within clusters and corresponding geographic distances. Box plots reflect cluster assignments at KMAX = 6, where clusters are arranged from the range interior to the edge (left to right). Cluster 4 is comprised of the three edge populations combined.
