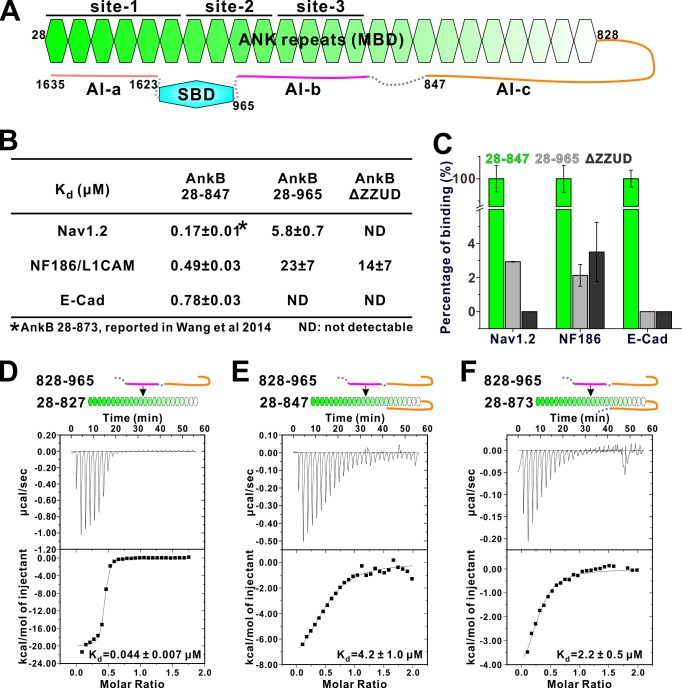
Figure 2. Two discrete segments in the AnkB linker region bind to MBD and inhibit its target binding.
(A) Schematic diagram showing the three autoinhibitory segments (AI-a, b, c) located at the linker and CT regions of AnkB. (B) ITC derived binding affinities showing that including longer linker region or the AI-a segment to the AnkB MBD weakened its bindings to targets including Nav1.2, NF186/L1CAM, and E-cadherin. (C) Bar graph showing the levels of target binding decreases resulted by the autoinhibitory segments based on the binding data in Panel B. (D–F) ITC profiles showing direct interactions between the entire linker region of AnkB and different versions of AnkB MBD (D: 28–827, no linker, measured in buffer containing 500 mM NaCl due to poor quality of this protein in 100 mM NaCl buffer; E: 28–847, short linker roughly comparable to the AnkR_C12 structure; F: 28–873, longer linker containing the entire AI-c).

