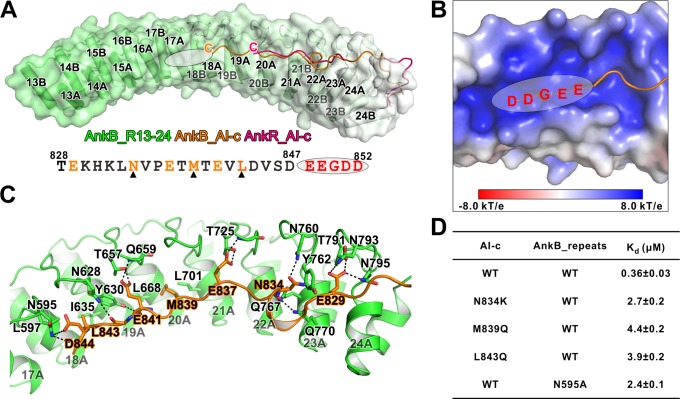
Figure 4. Detailed interaction between AnkB_AI-c and AnkB_MBD.
(A) Comparison of the structures of the AnkB_R13-24/AnkB_AI-c complex (colored in orange) and AnkR_C12 (colored in hot pink). The ANK repeats of AnkB are shown in cylinder and transparent surface and ANK repeats of AnkR are omitted for clarity. The folded back inhibitory sequence immediately following the ANK repeats in both structures are shown using the line model. The position of the stretch of negatively charged residues, which are not defined in the crystal structure, is indicated with a white oval. The amino acid sequence of AnkB_AI-c is also shown below the structure. Residues critical for the binding are shown in orange with those verified by mutagenesis highlighted by black triangles. (B) The charge potential surface of the inner groove formed by R16-17, calculated by the APBS module embedded in PyMOL and contoured at ±8 kT/e. (C) Detailed interactions between AnkB_AI-c and AnkB_MBD. (D) ITC derived dissociation constants showing mutations of critical residues weaken or abolish the binding between AnkB_AI-c and AnkB_MBD.

