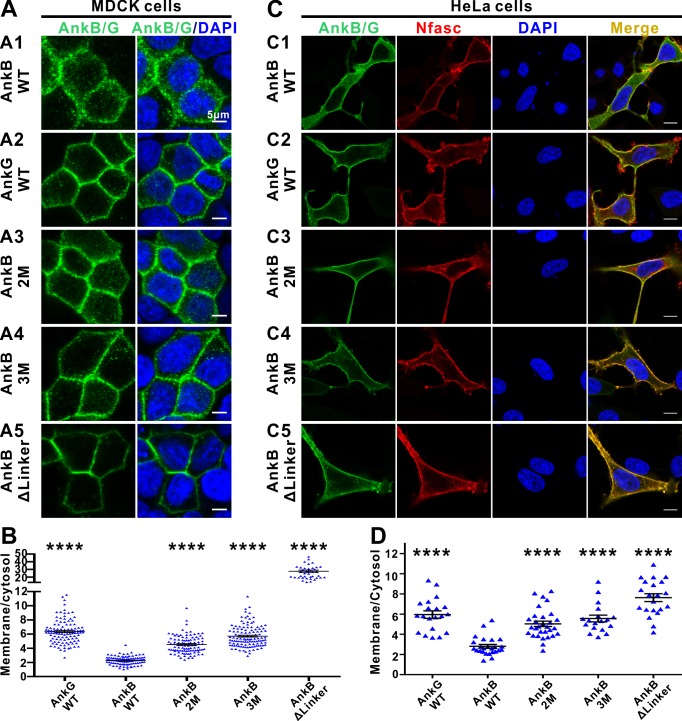
Figure 5. The autoinhibitory segments regulate subcellular localization of AnkB in MDCK cells and NF186-dependent membrane recruitment of AnkB in HeLa cells.
(A) Representative fluorescent images of transiently expressed GFP-tagged AnkG, AnkB or its linker mutants in polarized MDCK cells with nuclei stained with DAPI (blue): A1, WT AnkB; A2, WT AnkG; A3, AnkB_2M; A4, AnkB_3M; A5, AnkB ΔLinker. (B) Quantification of the immunofluorescence intensity ratio of plasma membrane vs cytosolic GFP signals. Data are presented as means ± SEM from>100 cells (except for AnkB ΔLinker with 41 cells due to its very clear membrane localizations) and analyzed using one way ANOVA followed by Dunnett’s multiple comparisons test to WT AnkB, ****p<0.0001. (C) Representative fluorescent images of HeLa cells transiently co-expressing HA-tagged NF186 (red) and GFP-tagged AnkG, AnkB or its linker mutants (green), with nuclei stained with DAPI (blue): C1, WT AnkB; C2, WT AnkG; C3, AnkB_2M; C4, AnkB_3M; C5, AnkB ΔLinker. (D) Quantification of the immunofluorescence intensity ratio of plasma membrane vs cytosolic GFP signals (representing AnkB/G level). Data are presented as means ± SEM from~20 cells and analyzed using one way ANOVA followed by Dunnett’s multiple comparisons test to WT AnkB, ****p<0.0001. The protein expression levels of all constructs in both cell lines are comparable as indicated by the quantified total fluorescence intensities of each groups in this experiment.

