Figure 3. Shisa2 inhibits Frizzled3 (Fzd3) glycosylation and translocation to the plasma membrane.
(A) Shisa2 was pulled down by Fzd3 in a co-immunoprecipitation assay. (B) Fzd3 was pulled down by Shisa2 in a co-immunoprecipitation assay. The major form of co-immunoprecipitated Fzd3 is the unmodified form. Arrows indicate the bands corresponding to different forms of Fzd3. (C) Fzd3 surface expression and glycosylation are inhibited by Shisa2. Cell surface proteins were labeled with biotin and then precipitated with Neutravidin agarose. Precipitants and total lysates were subject to immunoblotting with the indicated antibodies. p+G represents ‘phosphorylated and glycosylated’, G represents ‘glycosylated’, and U represents ‘unmodified’ Fzd3. (D) Quantification of cell-surface levels of Fzd3 (left panel) and the proportion of different forms of Fzd3 (right panel). Shisa2 overexpression robustly suppresses cell-surface expression of Fzd3. Shisa2 overexpression significantly increases the amount of ‘unmodified’ Fzd3 and reduces ‘glycosylated’ Fzd3. Data are the mean ±SD from four independent experiments. * denotes p<0.05, ** denotes p<0.005. (E) Fzd3–EGFP was retained in the ER in the presence of Shisa2. In the control, Fzd3–EGFP was localized widely in the periphery as well as in the perinuclear region, as indicated by Calnexin, an ER marker. By contrast, in Shisa2-overexpressing cells, most Fzd3–EGFP was retrained in the perinuclear region, co-localized with Shisa2 and Calnexin. Scale bar: 10 μm. N: nucleus. Dashed lines indicate cell outlines. (F) A schematic of Shisa2 effects on Fzd3 trafficking. Left: in control cells, Fzd3 is glycosylated in ER and translocated to the cell surface through the Golgi/trans-Golgi network. Right: in Shisa2-expressing cells, glycosylation of Fzd3 is inhibited and Fzd3 is not translocated to the cell surface.

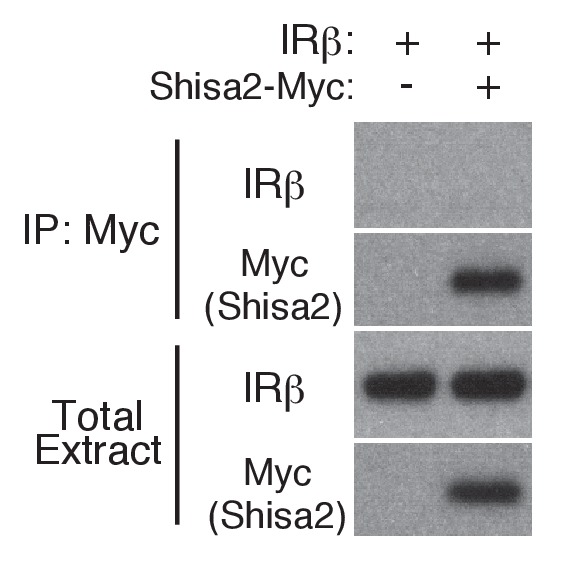
Figure 3—figure supplement 1. IRβ is not co-immunoprecipitated with Shisa2.