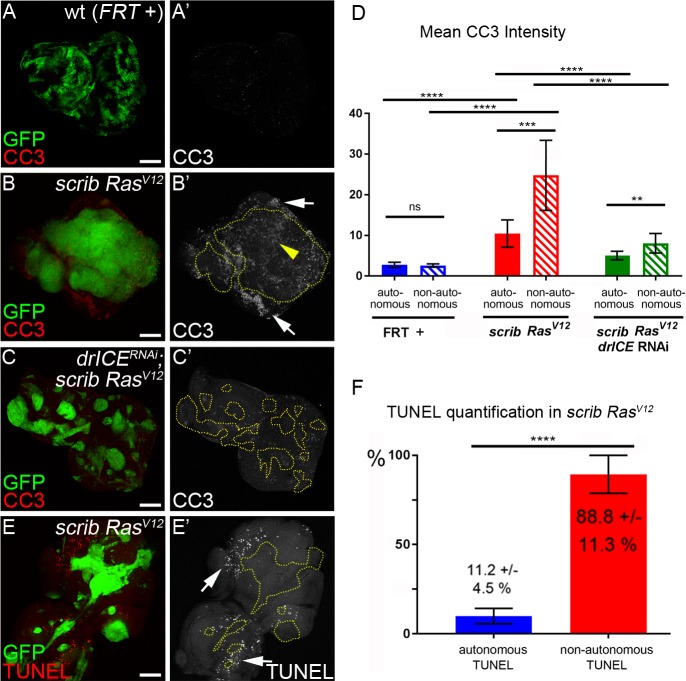
Figure 3. Analysis of caspase activity and apoptosis in scrib−/− RasV12 mosaic eye discs.
(A–C’) Cleaved caspase 3 (CC3) (red in (A–C); grey in (A’–C’)) analysis of control (wt, FRT +) (A), scrib−/− RasV12 (B) and scrib−/− RasV12 expressing drICE RNAi (C) mosaic eye imaginal discs. CC3 labeling is detectable autonomously (yellow arrowhead) and non-autonomously (white arrows) of scrib−/− RasV12 mutant clones (B’). Clones in (B’) and (C’) are outlined by yellow, dotted lines. Scale bars: 50 μm. (D) CC3 quantification of mosaic FRT + (control), scrib−/− RasV12 and drICERNAi;scrib−/− RasV12 eye-antennal imaginal discs reveals significant increase of caspase activity both inside (autonomously) and outside (non-autonomously) of scrib−/− RasV12 clones. Plotted is the mean signal intensity ±SD of autonomous and non-autonomous CC3 labelings, immediately adjacent to the clones. Analysis was performed by one-way ANOVA with Holm-Sidak test for multiple comparisons. ****p<0.0001; **p<0.01; ns – not significant. Ten discs per genotype were analyzed. (E) TUNEL assay as an apoptotic marker of scrib−/− RasV12 mosaic eye discs. White arrows mark TUNEL-positive cells outside scrib−/− RasV12 clones, outlined by yellow dotted lines. (F) TUNEL quantification reveals that almost 90% of apoptotic cells in scrib−/− RasV12 mosaic discs are outside of mutant clones. Autonomous and non-autonomous counts of TUNEL-positive cells were analyzed by paired student’s t-test. ****p<0.0001. The distribution of TUNEL-positive cells in seven discs is plotted. Genotypes: (A) yw ey-FLP/+; act>y+>Gal4, UAS-GFP56ST/+; FRT82B tub-Gal80/. FRT82B w+; (B,E) yw ey-FLP/+; act>y+>Gal4, UAS-GFP56ST/+; FRT82B tub-Gal80/UAS-RasV12 FRT82B scrib2; (C) yw ey-FLP/+; act>y+>Gal4, UAS-GFP56ST/UAS-drICERNAi; FRT82B tub-Gal80/UAS-RasV12 FRT82B scrib2.


