. 2017 Aug 30;6:e26747. doi: 10.7554/eLife.26747

Figure 5. JNK acts upstream and downstream of caspase activation and ROS generation.

(A–B’) Expression of JNKDN in scrib−/− RasV12 clones inhibits caspase activity (A,A’; CC3) and ROS generation (B,B’; DHE). Scale bars: 50 μm. (C–K’) pJNK labeling (red in (C–K); grey in (C’–K’)) as JNK marker in scrib−/− RasV12 (C,C’), JNKDN-expressing scrib−/− RasV12 (D,D’) and ROS-depleted or caspase-inhibited scrib−/− RasV12 mosaic discs (E–K’). The strong pJNK labeling in (C,C’) is significantly reduced in (D–K’). Scale bars: 50 μm. (L) The mean intensity of pJNK labelings in scrib−/− RasV12 clones in panels (C’–K’) is significantly reduced upon ROS-depletion or reduction of caspase activity. Analysis of JNK labelings was done by one-way ANOVA with Holm-Sidak test for multiple comparisons. Error bars are SD. P values are referenced to scrib−/− RasV12 and are indicated by asterisks above each column. ****p<0.0001. At least ten discs per genotype were analyzed. Genotypes: (A,B,D) yw ey-FLP/UAS-JNKDN; act>y+>Gal4, UAS-GFP56ST/+; FRT82B tub-Gal80/UAS-RasV12 FRT82B scrib2; (C) yw ey-FLP/+; act>y+>Gal4, UAS-GFP56ST/+; FRT82B tub-Gal80/UAS-RasV12 FRT82B scrib2; (E–K) yw ey-FLP/+; act>y+>Gal4, UAS-GFP56ST/UAS-X; FRT82B tub-Gal80/UAS-RasV12 FRT82B scrib2 with UAS-X being UAS-droncRNAi (E), UAS-drICERNAi (F), UAS-p35 (G), UAS-DuoxRNAi (H), UAS-hCatS (I), UAS-Catalase (J) and UAS-SOD2 (K).

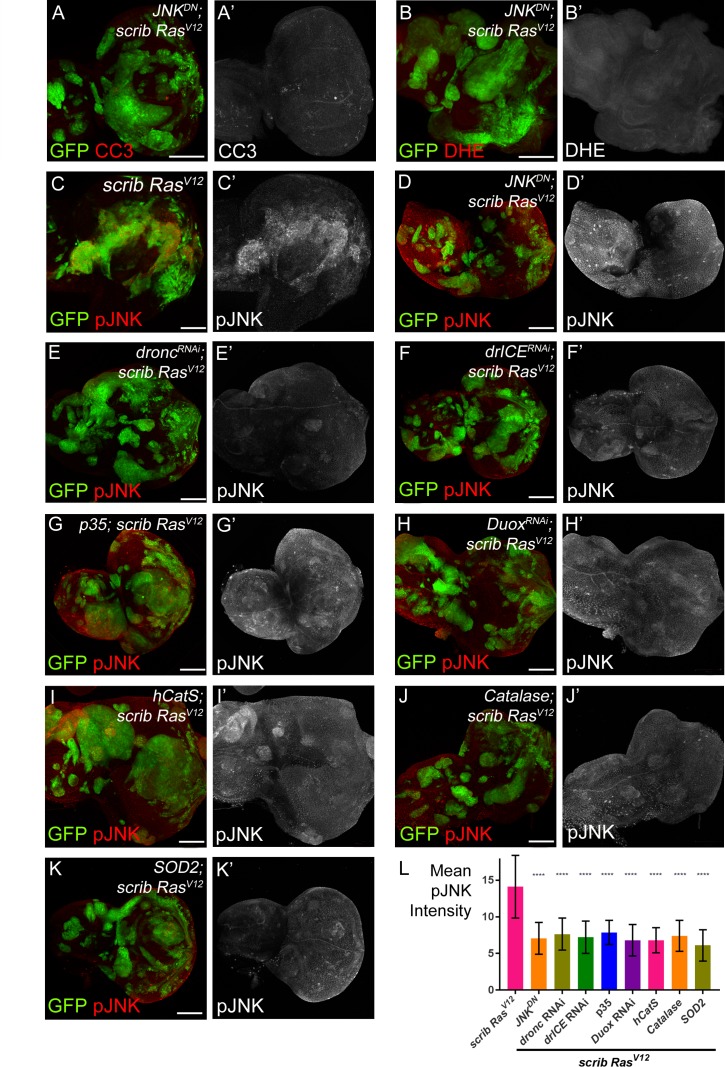
Figure 5.

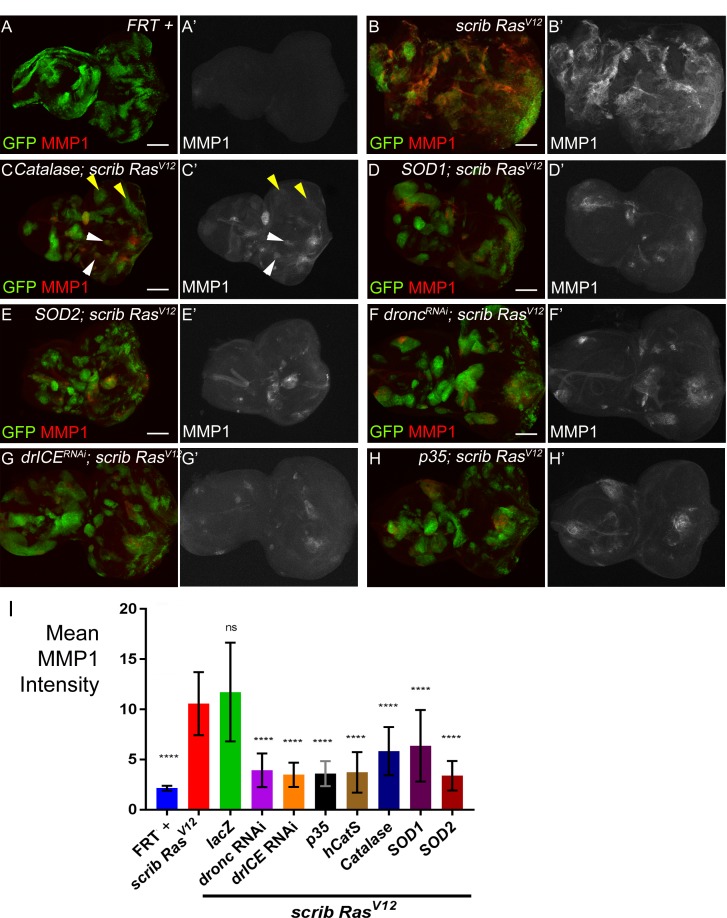
Figure 5—figure supplement 1. MMP1 labeling is reduced in scrib−/− RasV12 clones with reduced ROS or caspase activity.

Figure 5—figure supplement 1.

(A–H’) MMP1 labeling (red in (A–H); grey in (A’–H’)) as JNK marker in control discs (FRT +) (A,A’), scrib−/− RasV12 mosaic discs (B,B’) and ROS-depleted or caspase-inhibited scrib−/− RasV12 mosaic discs (C–H’). The strong MMP1 labeling in (B,B’) is significantly reduced in (C–H’). Arrowheads in (C,C’) highlight representative examples of clones with low (white) or no (yellow) MMP1 labeling. Scale bars: 50 μm. (I) The mean intensity of MMP1 labelings in scrib−/− RasV12 clones in panels (C’–H’) is significantly reduced upon ROS-depletion or reduction of caspase activity compared to scrib−/− RasV12 mutant clones (B’). Analysis of MMP1 labelings was done by one-way ANOVA with Holm-Sidak test for multiple comparisons. Error bars are SD. P values are referenced to scrib−/− RasV12 and are indicated by asterisks above each column. ****p<0.0001, ns – not significant. At least ten discs per genotype were analyzed. Genotypes: (A) yw ey-FLP/+; act>y+>Gal4, UAS-GFP56ST/+; FRT82B tub-Gal80/FRT82B w+; (B) yw ey-FLP/+; act>y+>Gal4, UAS-GFP56ST/+; FRT82B tub-Gal80/UAS-RasV12 FRT82B scrib2; (C–H) yw ey-FLP/+; act>y+>Gal4, UAS-GFP56ST/UAS-X; FRT82B tub-Gal80/UAS-RasV12 FRT82B scrib2 with UAS-X being UAS-Catalase (C), UAS-SOD1 (D), UAS-SOD2 (E), UAS-droncRNAi (F), UAS-drICERNAi (G) and UAS-p35 (H).